| sids_region | OHRLLS-listed SIDS | Associate Member SIDS | Other island economy |
|---|---|---|---|
| AIMS | 8 | 0 | 0 |
| Caribbean | 16 | 13 | 1 |
| Pacific | 15 | 5 | 0 |
Technical Analysis
Tourism Dependence and the 2020 Shock: Full Results
Candidate Universe and Sample Definitions
Three fixed samples
Sample membership is defined by 2017–2019 data availability and is fixed — it does not change when the baseline window is varied. Changes in N across specifications reflect only baseline-window coverage within a fixed set of countries.
| Sample | Criterion | N |
|---|---|---|
| Candidate universe | All 58 economies | 58 |
| Tourism-data sample | At least one tourism indicator, 2017-2019 | 48 |
| OWID shock sample | OWID vspend (2017-19) + 2020 GDP growth | 29 |
| WDI shock sample | WDI receipts (2017-19) + 2020 GDP growth | 35 |
| Common sample | Both indicators (2017-19) + 2020 GDP growth | 24 |
| Recovery sample | OWID shock sample + real GDP (2019 + later year) | 29 |
OWID-only economies (in OWID shock sample but not common sample): BRB, CUB, PRI, TUV, VIR.
WDI-only economies (in WDI shock sample but not common sample): DMA, DOM, GRD, HTI, KNA, LCA, NRU, PLW, SGP, STP, TLS.
Analytical panel note. The candidate universe contains 58 economies; the analytical panel contains data for 57. BES (Bonaire, Sint Eustatius and Saba) is the one economy present in the candidate universe but absent from the panel: it has no coverage in any OWID dataset and no World Bank API coverage, so the full join that constructs the panel produces no rows for it. The remaining six WDI-absent economies (AIA, GLP, MTQ, MSR, COK, NIU) have at least partial OWID data and therefore appear in the panel with WDI columns missing. None of the seven WDI-absent economies qualifies for any shock or recovery sample.
Tourism Indicator Coverage
Coverage matrix
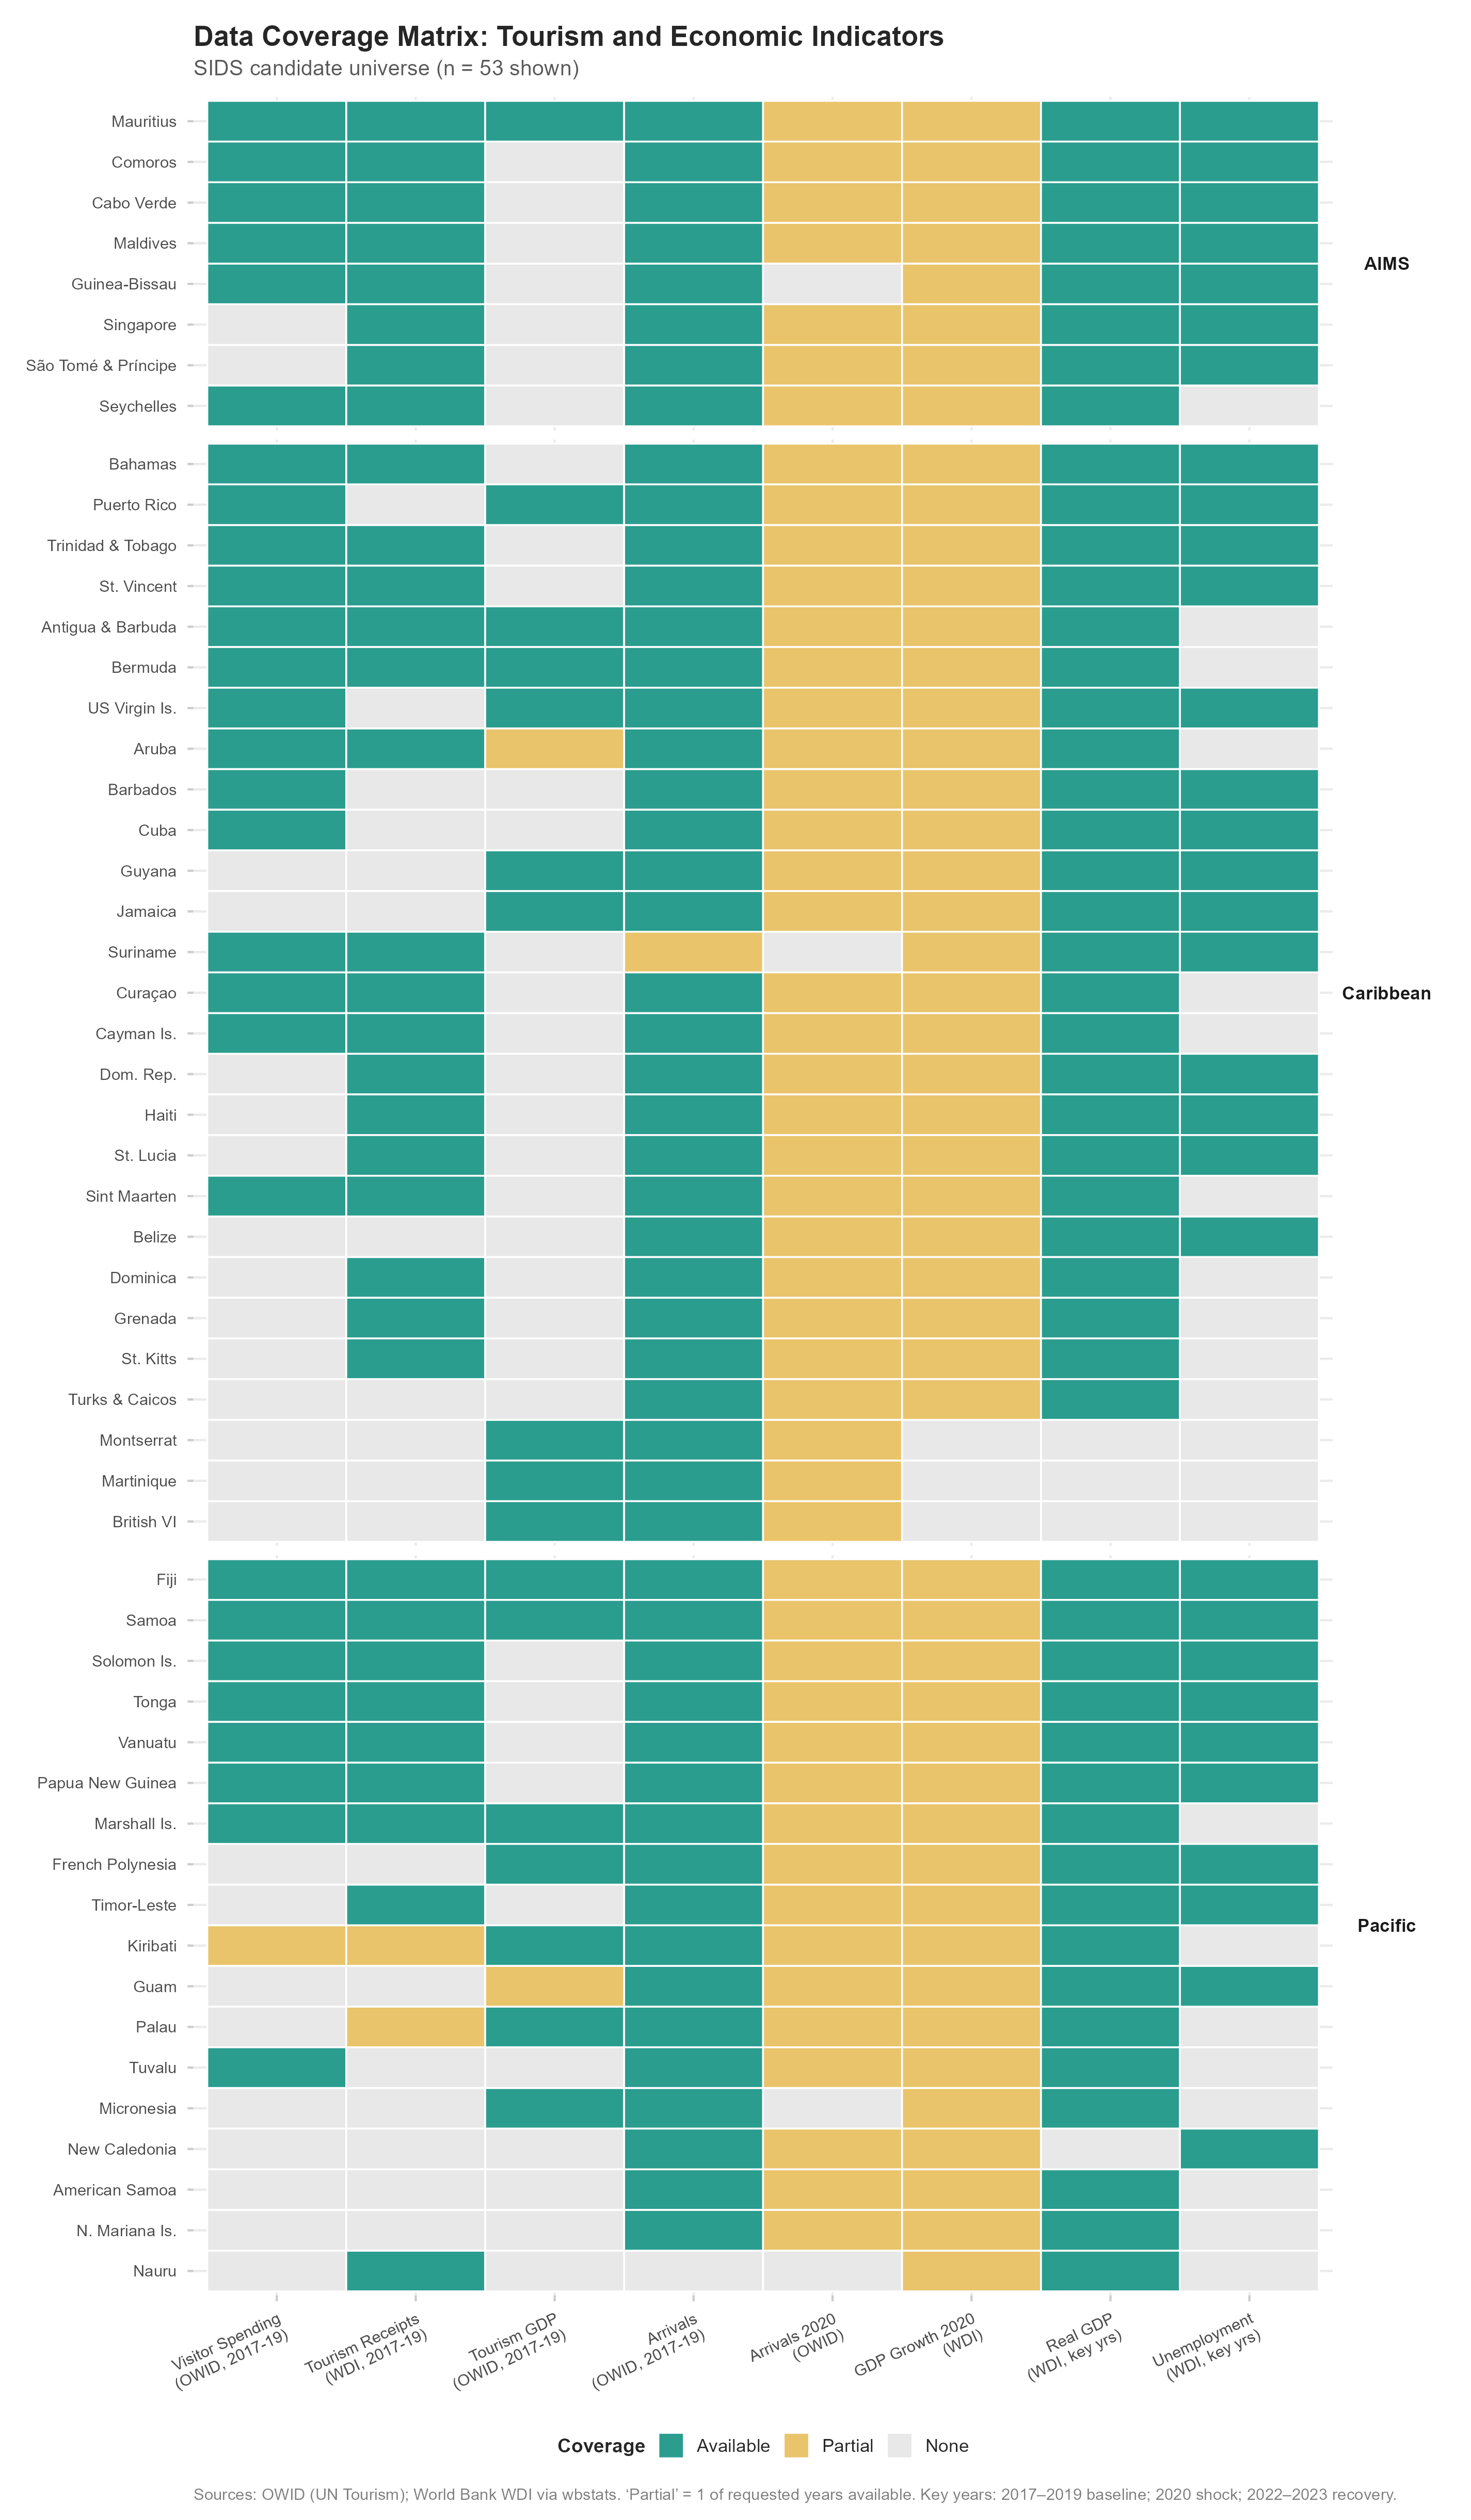
WDI receipts: end of series in this retrieval
WDI ST.INT.RCPT.XP.ZS has no observations beyond 2020 in the retrieved data. This does not appear to be a simple publication lag; it likely reflects a change in UN Tourism’s data dissemination approach following the pandemic. The pre-pandemic coverage is also uneven: 14 of 35 WDI sample members have no 2019 receipts observation, meaning their 2017–2019 baseline draws on 2017 and 2018 only. The OWID visitor spending series, by contrast, is available through 2024 with near-complete coverage.
| Indicator | Latest year in retrieval | 2019 available? | Notes |
|---|---|---|---|
| OWID visitor spending (% GDP) | 2024 | Yes (all sample members) | Updated 2026 |
| WDI receipts (% exports) | 2020 | 21 of 35 only | Series ends 2020; 14/35 lack 2019 data |
| WDI real GDP (const. 2015 USD) | 2024–2025 | Yes (all sample members) | 2025 preliminary for 22/29 |
Baseline coverage distributions
| Sample | Indicator | Window | 0 obs | 1 obs | 2 obs | 3 obs | 4 obs | 5 obs |
|---|---|---|---|---|---|---|---|---|
| OWID (N=29) | OWID vspend | 2015-19 | 0 | 1 | 0 | 1 | 1 | 26 |
| OWID (N=29) | OWID vspend | 2017-19 | 0 | 1 | 0 | 28 | 0 | 0 |
| OWID (N=29) | WDI receipts | 2015-19 | 4 | 1 | 1 | 2 | 2 | 19 |
| OWID (N=29) | WDI receipts | 2017-19 | 5 | 1 | 2 | 21 | 0 | 0 |
| WDI (N=35) | OWID vspend | 2015-19 | 10 | 2 | 0 | 0 | 1 | 22 |
| WDI (N=35) | OWID vspend | 2017-19 | 11 | 1 | 0 | 23 | 0 | 0 |
| WDI (N=35) | WDI receipts | 2015-19 | 0 | 1 | 0 | 3 | 12 | 19 |
| WDI (N=35) | WDI receipts | 2017-19 | 0 | 2 | 12 | 21 | 0 | 0 |
| Common (N=24) | OWID vspend | 2015-19 | 0 | 1 | 0 | 0 | 1 | 22 |
| Common (N=24) | OWID vspend | 2017-19 | 0 | 1 | 0 | 23 | 0 | 0 |
| Common (N=24) | WDI receipts | 2015-19 | 0 | 1 | 0 | 2 | 2 | 19 |
| Common (N=24) | WDI receipts | 2017-19 | 0 | 1 | 2 | 21 | 0 | 0 |
Indicator Comparison
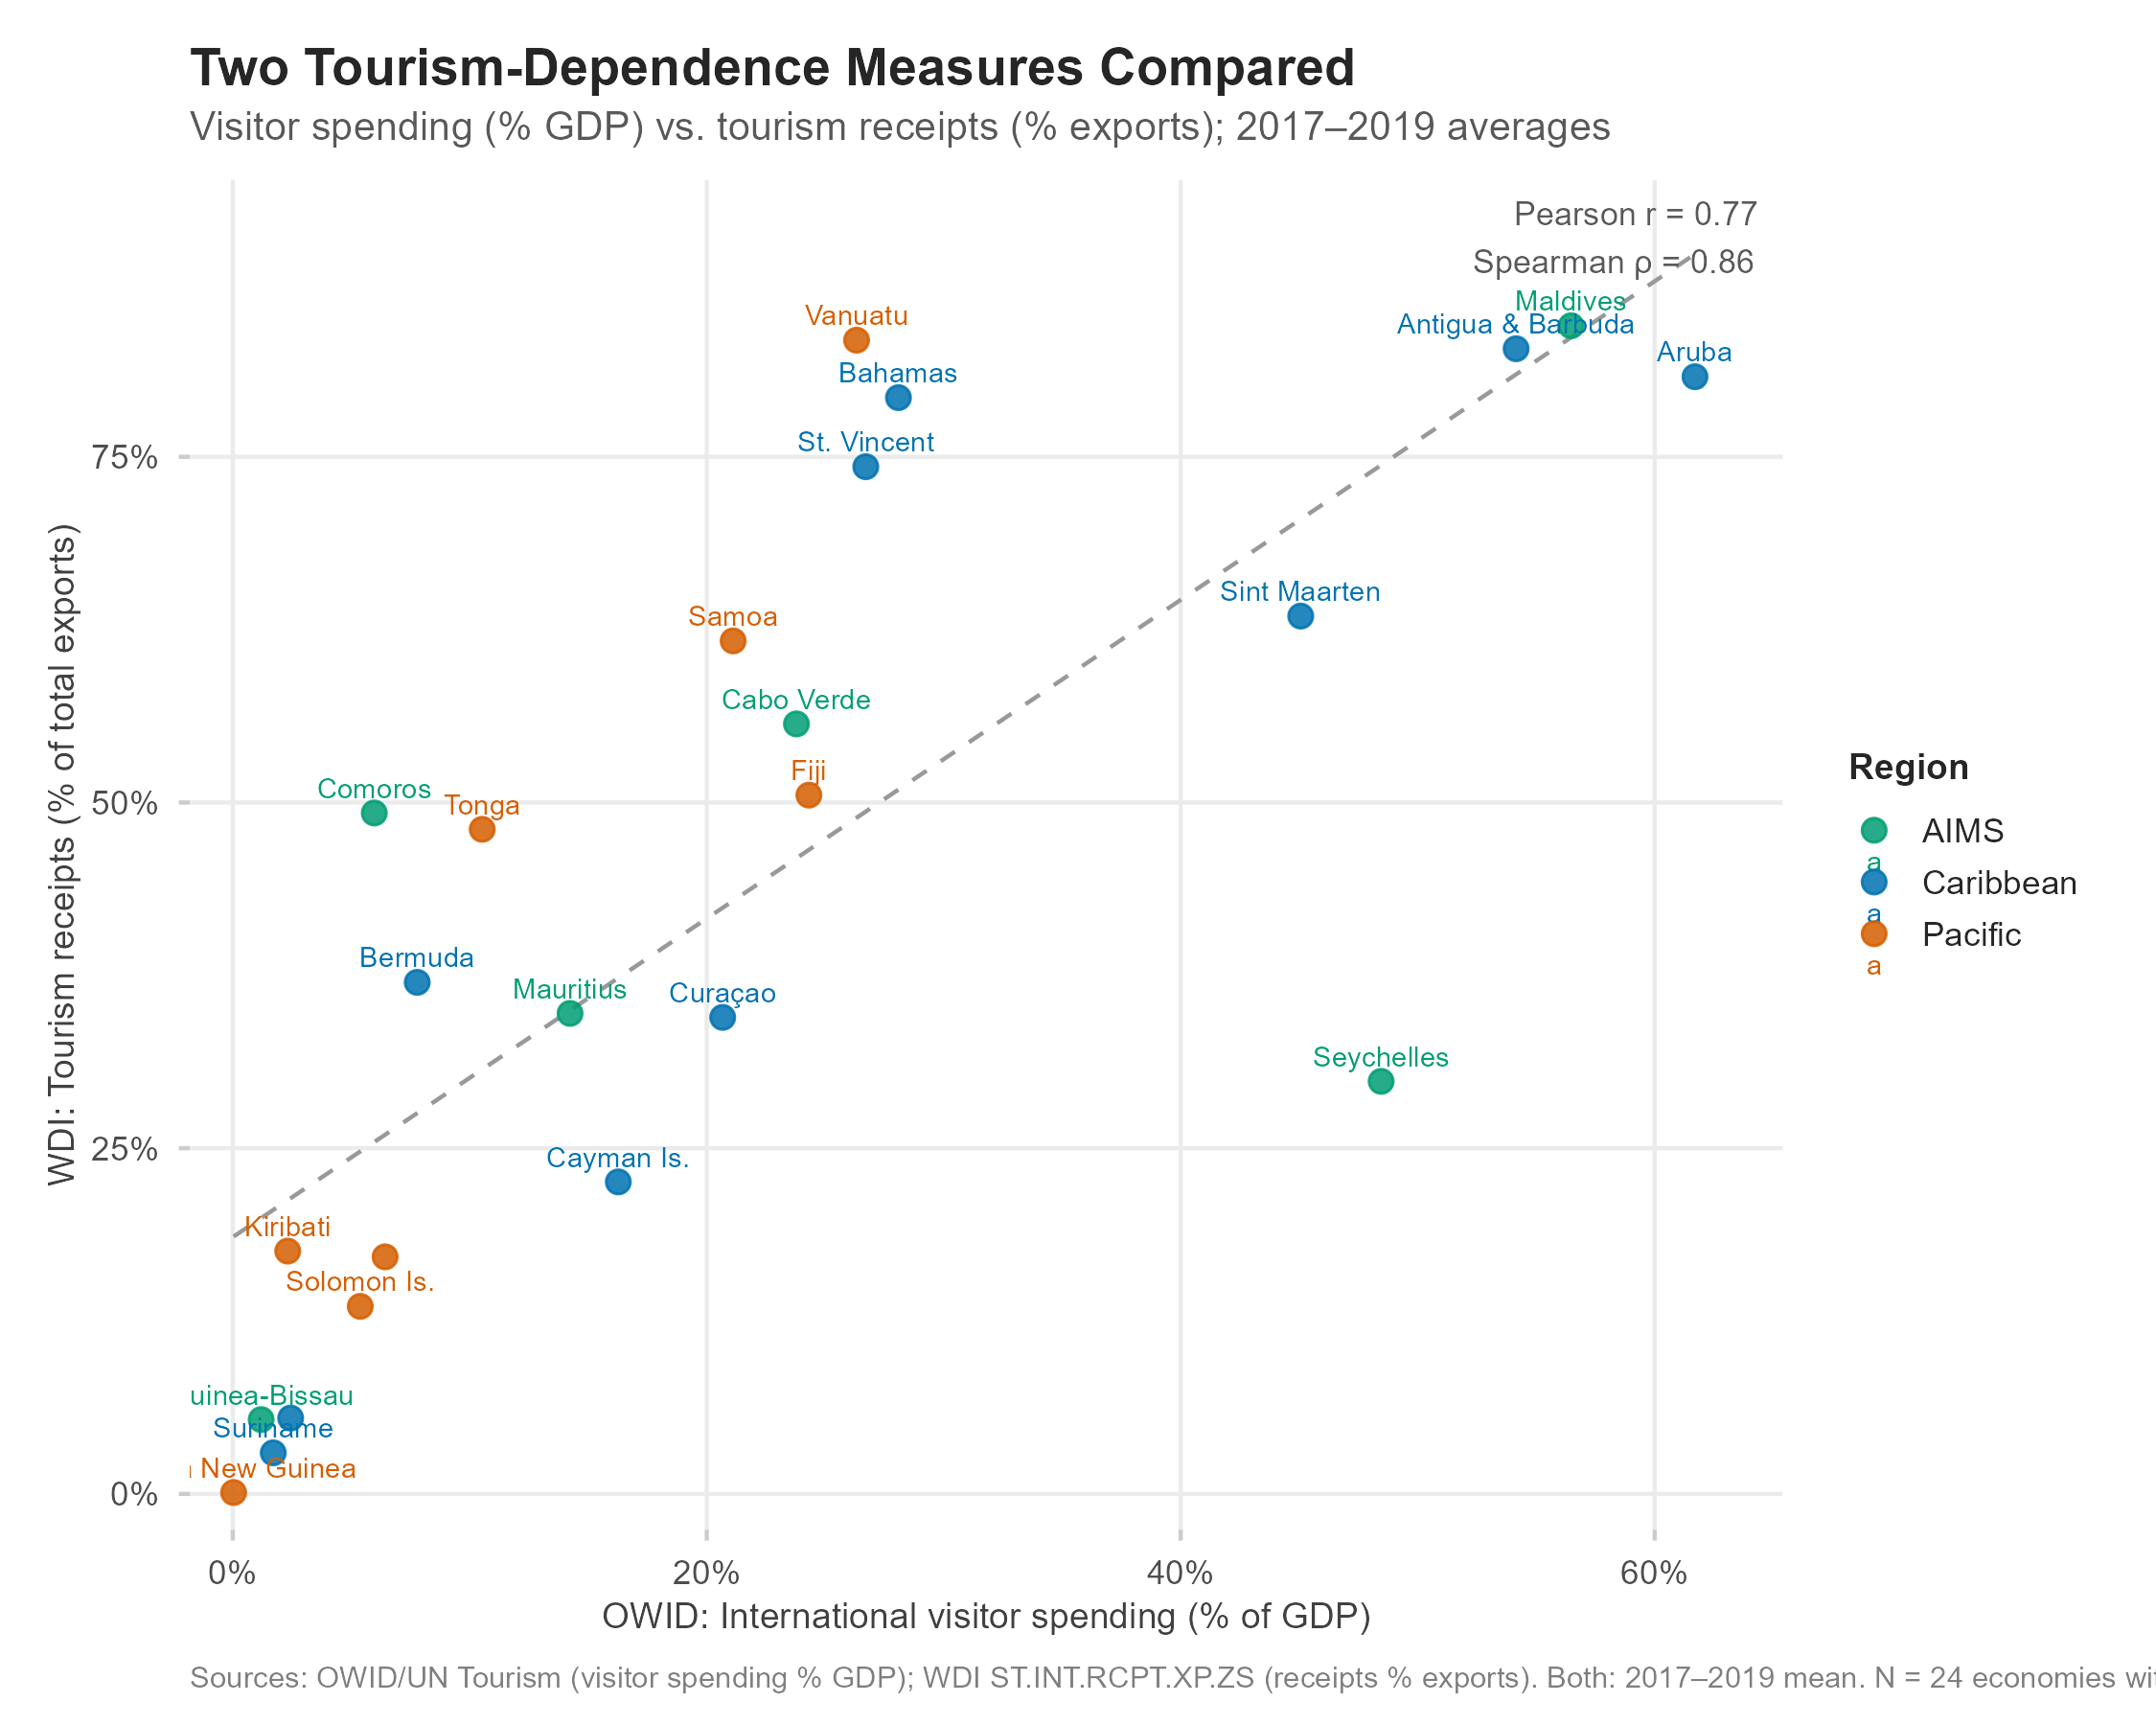
The Pearson correlation between the two indicators (across economies with both) is approximately 0.77, and the Spearman rank correlation is 0.86. They produce similar rankings but material differences for some economies. The WDI receipts/exports denominator amplifies the apparent dependence of export-intensive small economies, while the OWID visitor spending/GDP denominator captures the share of overall economic activity attributable to visitors.
Eight-Model Shock Analysis
Outcome: 2020 annual GDP growth (%, WDI NY.GDP.MKTP.KD.ZG).
Note: The 2015–2019 primary window was evaluated after the 2017–2019 results were already observed. No window was designated a priori. All eight results are reported.
| Model | Indicator | Window | Sample | N | Slope | 95% CI | R2 | Pearson_r | Spearman_rho | p_raw | p_holm |
|---|---|---|---|---|---|---|---|---|---|---|---|
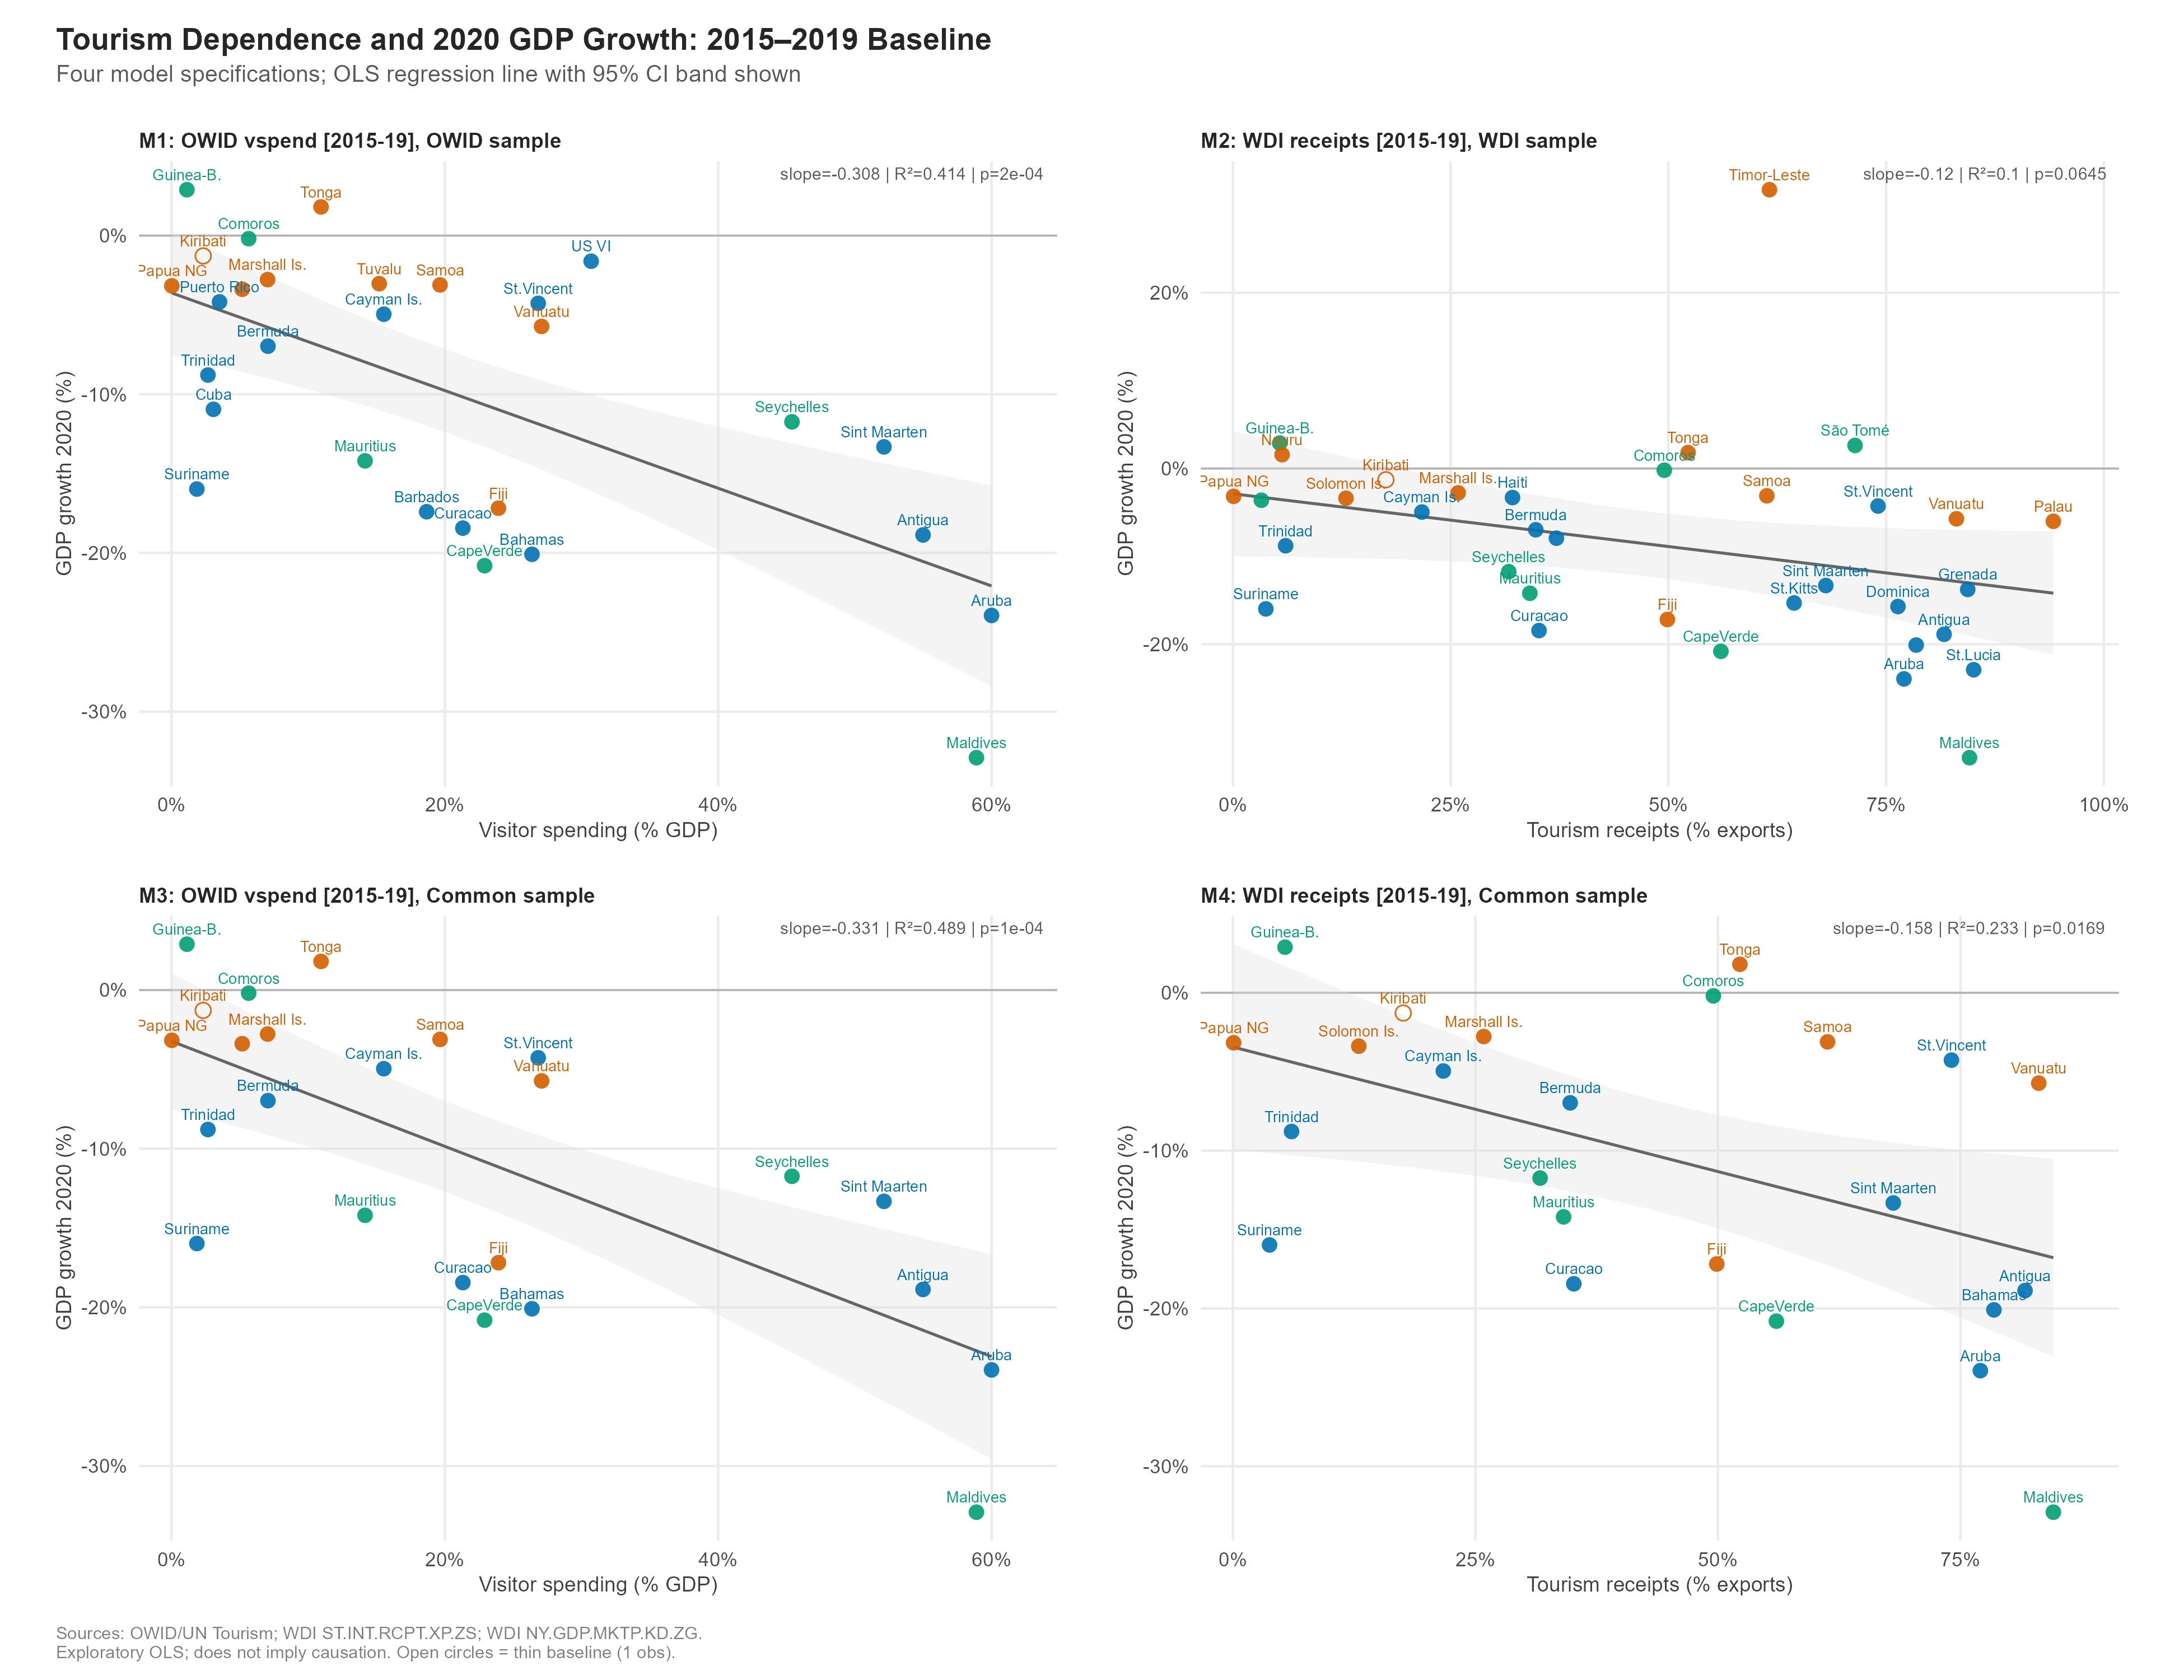
| 1 | OWID vspend | 2015-19 | OWID (N=29) | 29 | -0.308 | [-0.453, -0.163] | 0.414 | -0.643 | -0.550 | 0.000 | 0.001 |
| 2 | WDI receipts | 2015-19 | WDI (N=35) | 35 | -0.120 | [-0.248, 0.008] | 0.100 | -0.316 | -0.443 | 0.064 | 0.129 |
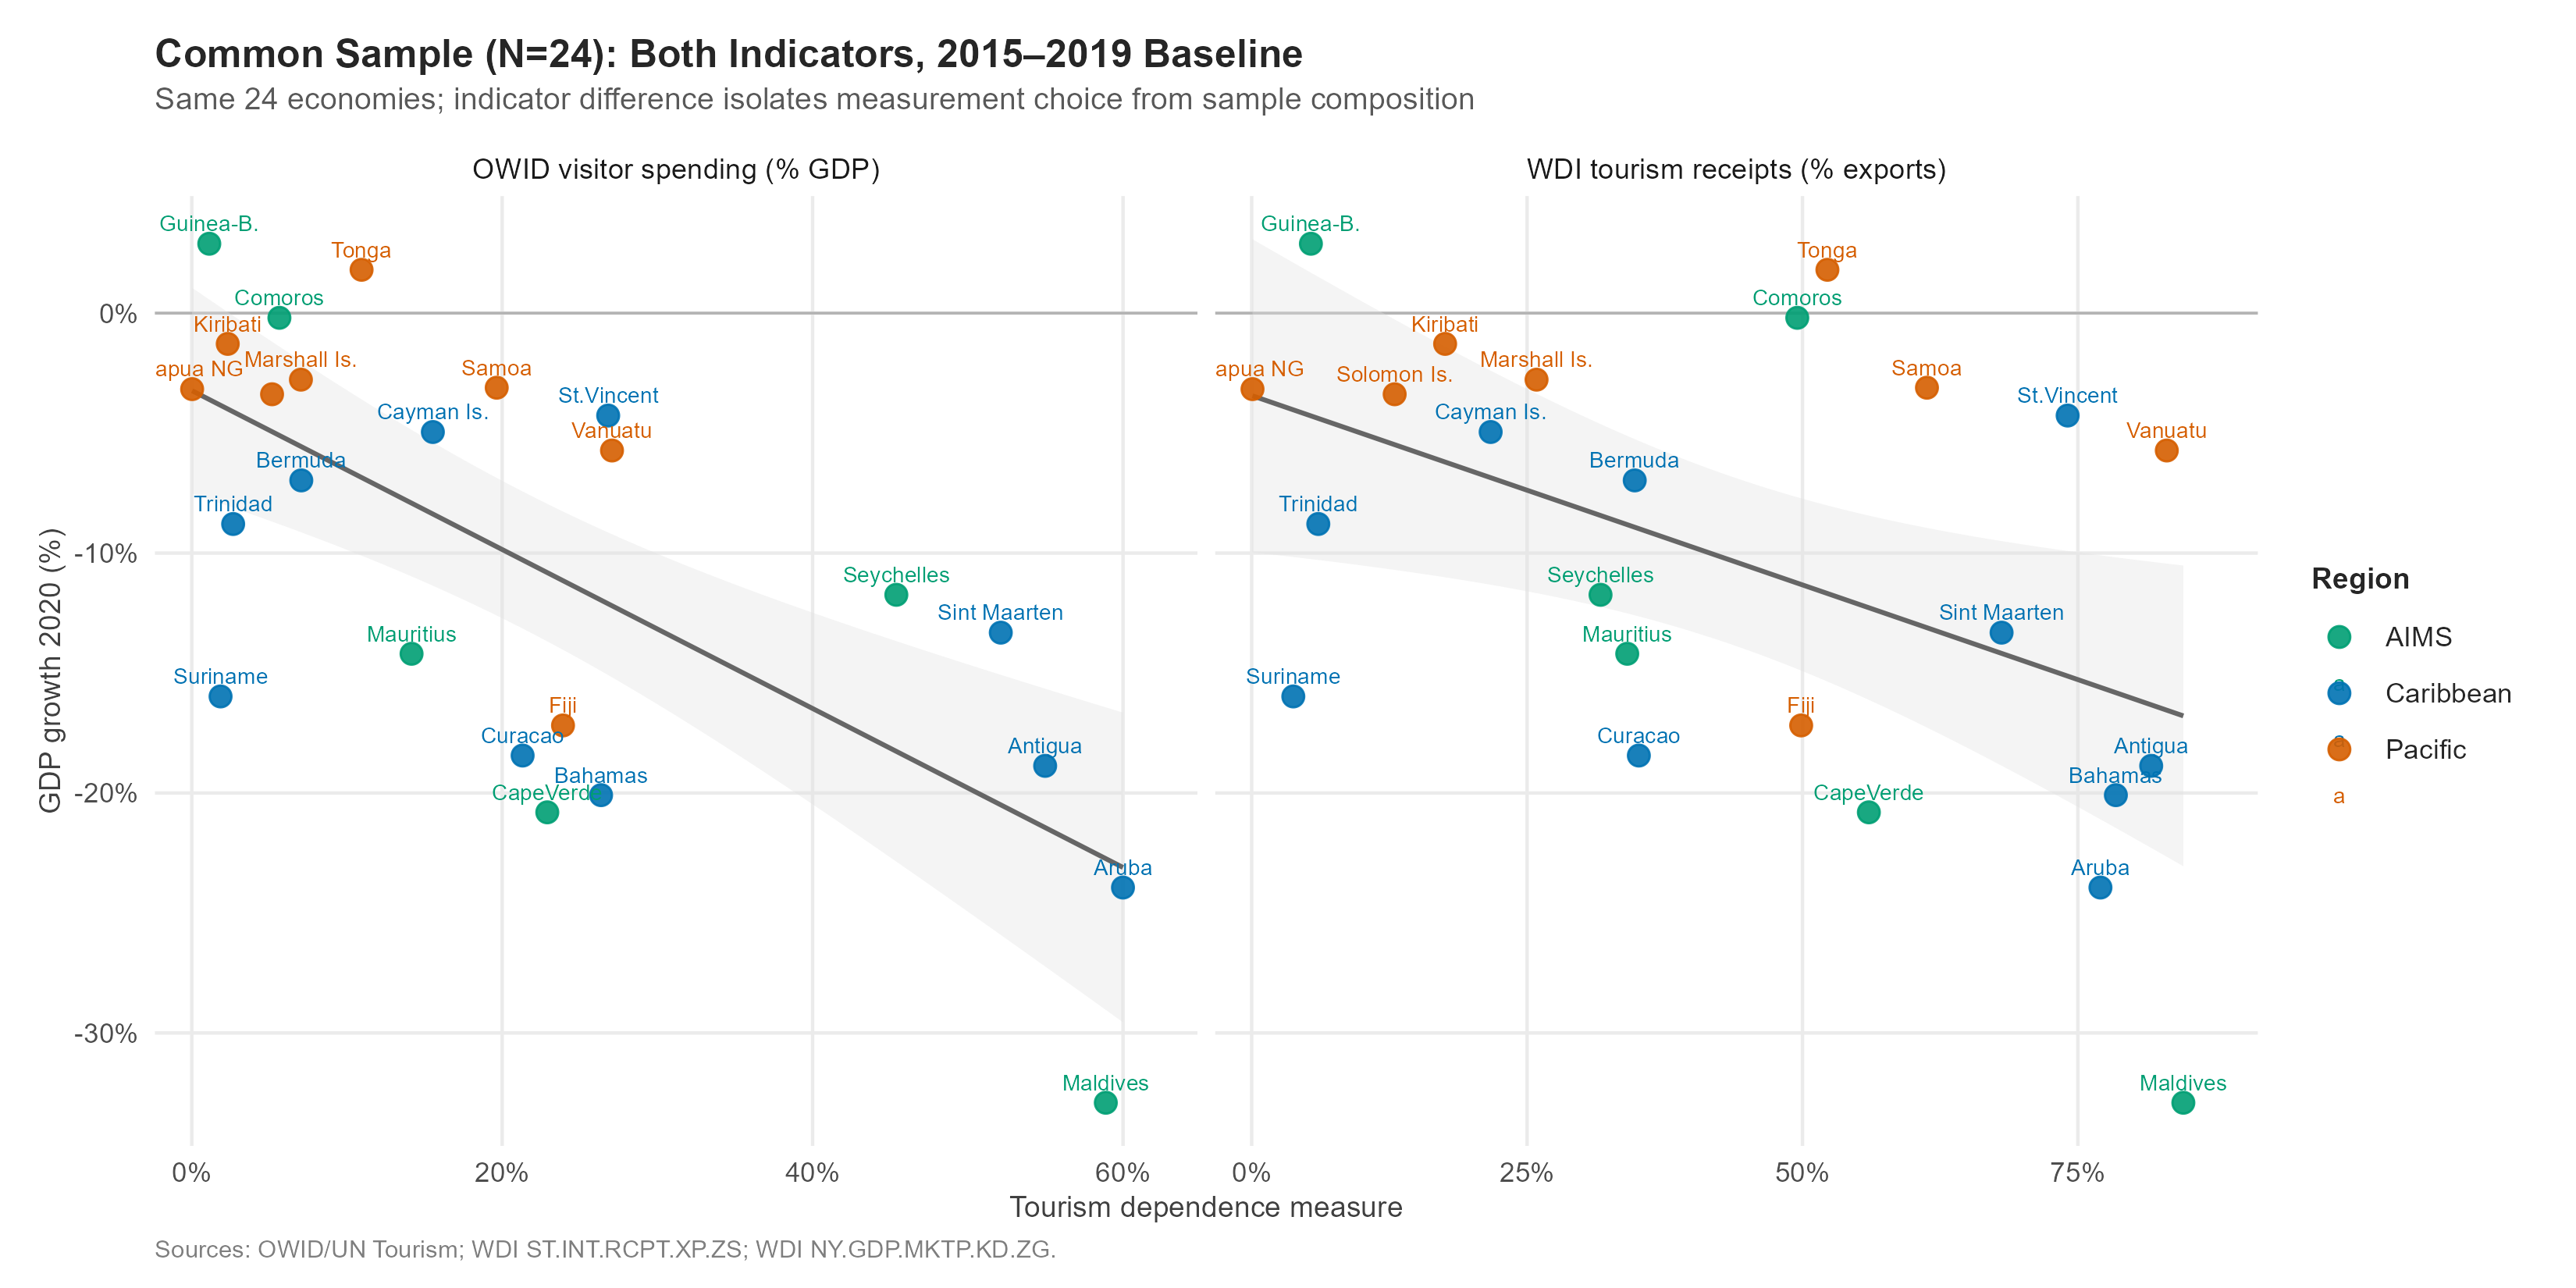
| 3 | OWID vspend | 2015-19 | Common (N=24) | 24 | -0.331 | [-0.481, -0.181] | 0.489 | -0.699 | -0.655 | 0.000 | 0.001 |
| 4 | WDI receipts | 2015-19 | Common (N=24) | 24 | -0.158 | [-0.285, -0.031] | 0.233 | -0.483 | -0.480 | 0.017 | 0.053 |
| 5 | OWID vspend | 2017-19 | OWID (N=29) | 29 | -0.320 | [-0.465, -0.174] | 0.428 | -0.654 | -0.564 | 0.000 | 0.001 |
| 6 | WDI receipts | 2017-19 | WDI (N=35) | 35 | -0.116 | [-0.242, 0.01] | 0.097 | -0.311 | -0.432 | 0.069 | 0.129 |
| 7 | OWID vspend | 2017-19 | Common (N=24) | 24 | -0.339 | [-0.491, -0.187] | 0.493 | -0.702 | -0.660 | 0.000 | 0.001 |
| 8 | WDI receipts | 2017-19 | Common (N=24) | 24 | -0.160 | [-0.284, -0.037] | 0.248 | -0.498 | -0.491 | 0.013 | 0.053 |
Four-panel figure (2015–2019 baseline)
Common-sample comparison
The common sample (N = 24) holds the country set constant and varies only the indicator. Any difference in results between the two panels below reflects the indicator choice, not sample composition.
Influential observations
| Model | Most influential | Cook’s D | Slope (orig.) | Slope (excl.) | R² (orig.) | R² (excl.) | p (excl.) |
|---|---|---|---|---|---|---|---|
| M1 OWID/2015-19/OWID (N=29) | MDV | 0.392 | -0.308 | -0.251 | 0.414 | 0.309 | 0.002 |
| M2 WDI/2015-19/WDI (N=35) | TLS | 0.287 | -0.120 | -0.141 | 0.100 | 0.224 | 0.005 |
| M3 OWID/2015-19/Common (N=24) | MDV | 0.363 | -0.331 | -0.276 | 0.489 | 0.389 | 0.002 |
| M4 WDI/2015-19/Common (N=24) | MDV | 0.339 | -0.158 | -0.116 | 0.233 | 0.157 | 0.062 |
| M5 OWID/2017-19/OWID (N=29) | MDV | 0.384 | -0.320 | -0.263 | 0.428 | 0.331 | 0.001 |
| M6 WDI/2017-19/WDI (N=35) | TLS | 0.324 | -0.116 | -0.142 | 0.097 | 0.234 | 0.004 |
| M7 OWID/2017-19/Common (N=24) | MDV | 0.362 | -0.339 | -0.284 | 0.493 | 0.402 | 0.001 |
| M8 WDI/2017-19/Common (N=24) | MDV | 0.334 | -0.160 | -0.120 | 0.248 | 0.173 | 0.048 |
Why Timor-Leste influences M2 and M6: Timor-Leste has moderately high WDI tourism receipts as a share of exports but experienced a modest 2020 contraction, making it a structural outlier in the WDI receipts models. Excluding it makes those models stronger, not weaker — a counter-intuitive diagnostic result worth noting.
Coverage-restricted sensitivity (≥3 baseline observations)
| Sensitivity | Window | Indicator | Sample | N | Slope | R2 | Spearman | p_raw | Excluded |
|---|---|---|---|---|---|---|---|---|---|
| S1 | 2015-19 | OWID vspend | OWID | 28 | -0.302 | 0.397 | -0.522 | 0.0003 | KIR |
| S2 | 2015-19 | WDI receipts | WDI | 34 | -0.116 | 0.092 | -0.432 | 0.0820 | KIR |
| S3 | 2015-19 | OWID vspend | Common | 23 | -0.325 | 0.470 | -0.637 | 0.0003 | KIR |
| S4 | 2017-19 | OWID vspend | OWID | 28 | -0.314 | 0.412 | -0.537 | 0.0002 | KIR |
| S5 | 2017-19 | WDI receipts | WDI | 21 | -0.143 | 0.180 | -0.422 | 0.0554 | DMA,DOM,GRD,HTI,KIR,KNA,LCA,MHL,NRU,PLW,PNG,SGP,STP,TLS |
| S6 | 2017-19 | OWID vspend | Common | 23 | -0.333 | 0.474 | -0.643 | 0.0003 | KIR |
Recovery Analysis
Coverage
| year | N with real GDP |
|---|---|
| 2015 | 29 |
| 2016 | 29 |
| 2017 | 29 |
| 2018 | 29 |
| 2019 | 29 |
| 2020 | 29 |
| 2021 | 29 |
| 2022 | 29 |
| 2023 | 28 |
| 2024 | 28 |
| 2025 | 22 |
Trajectories
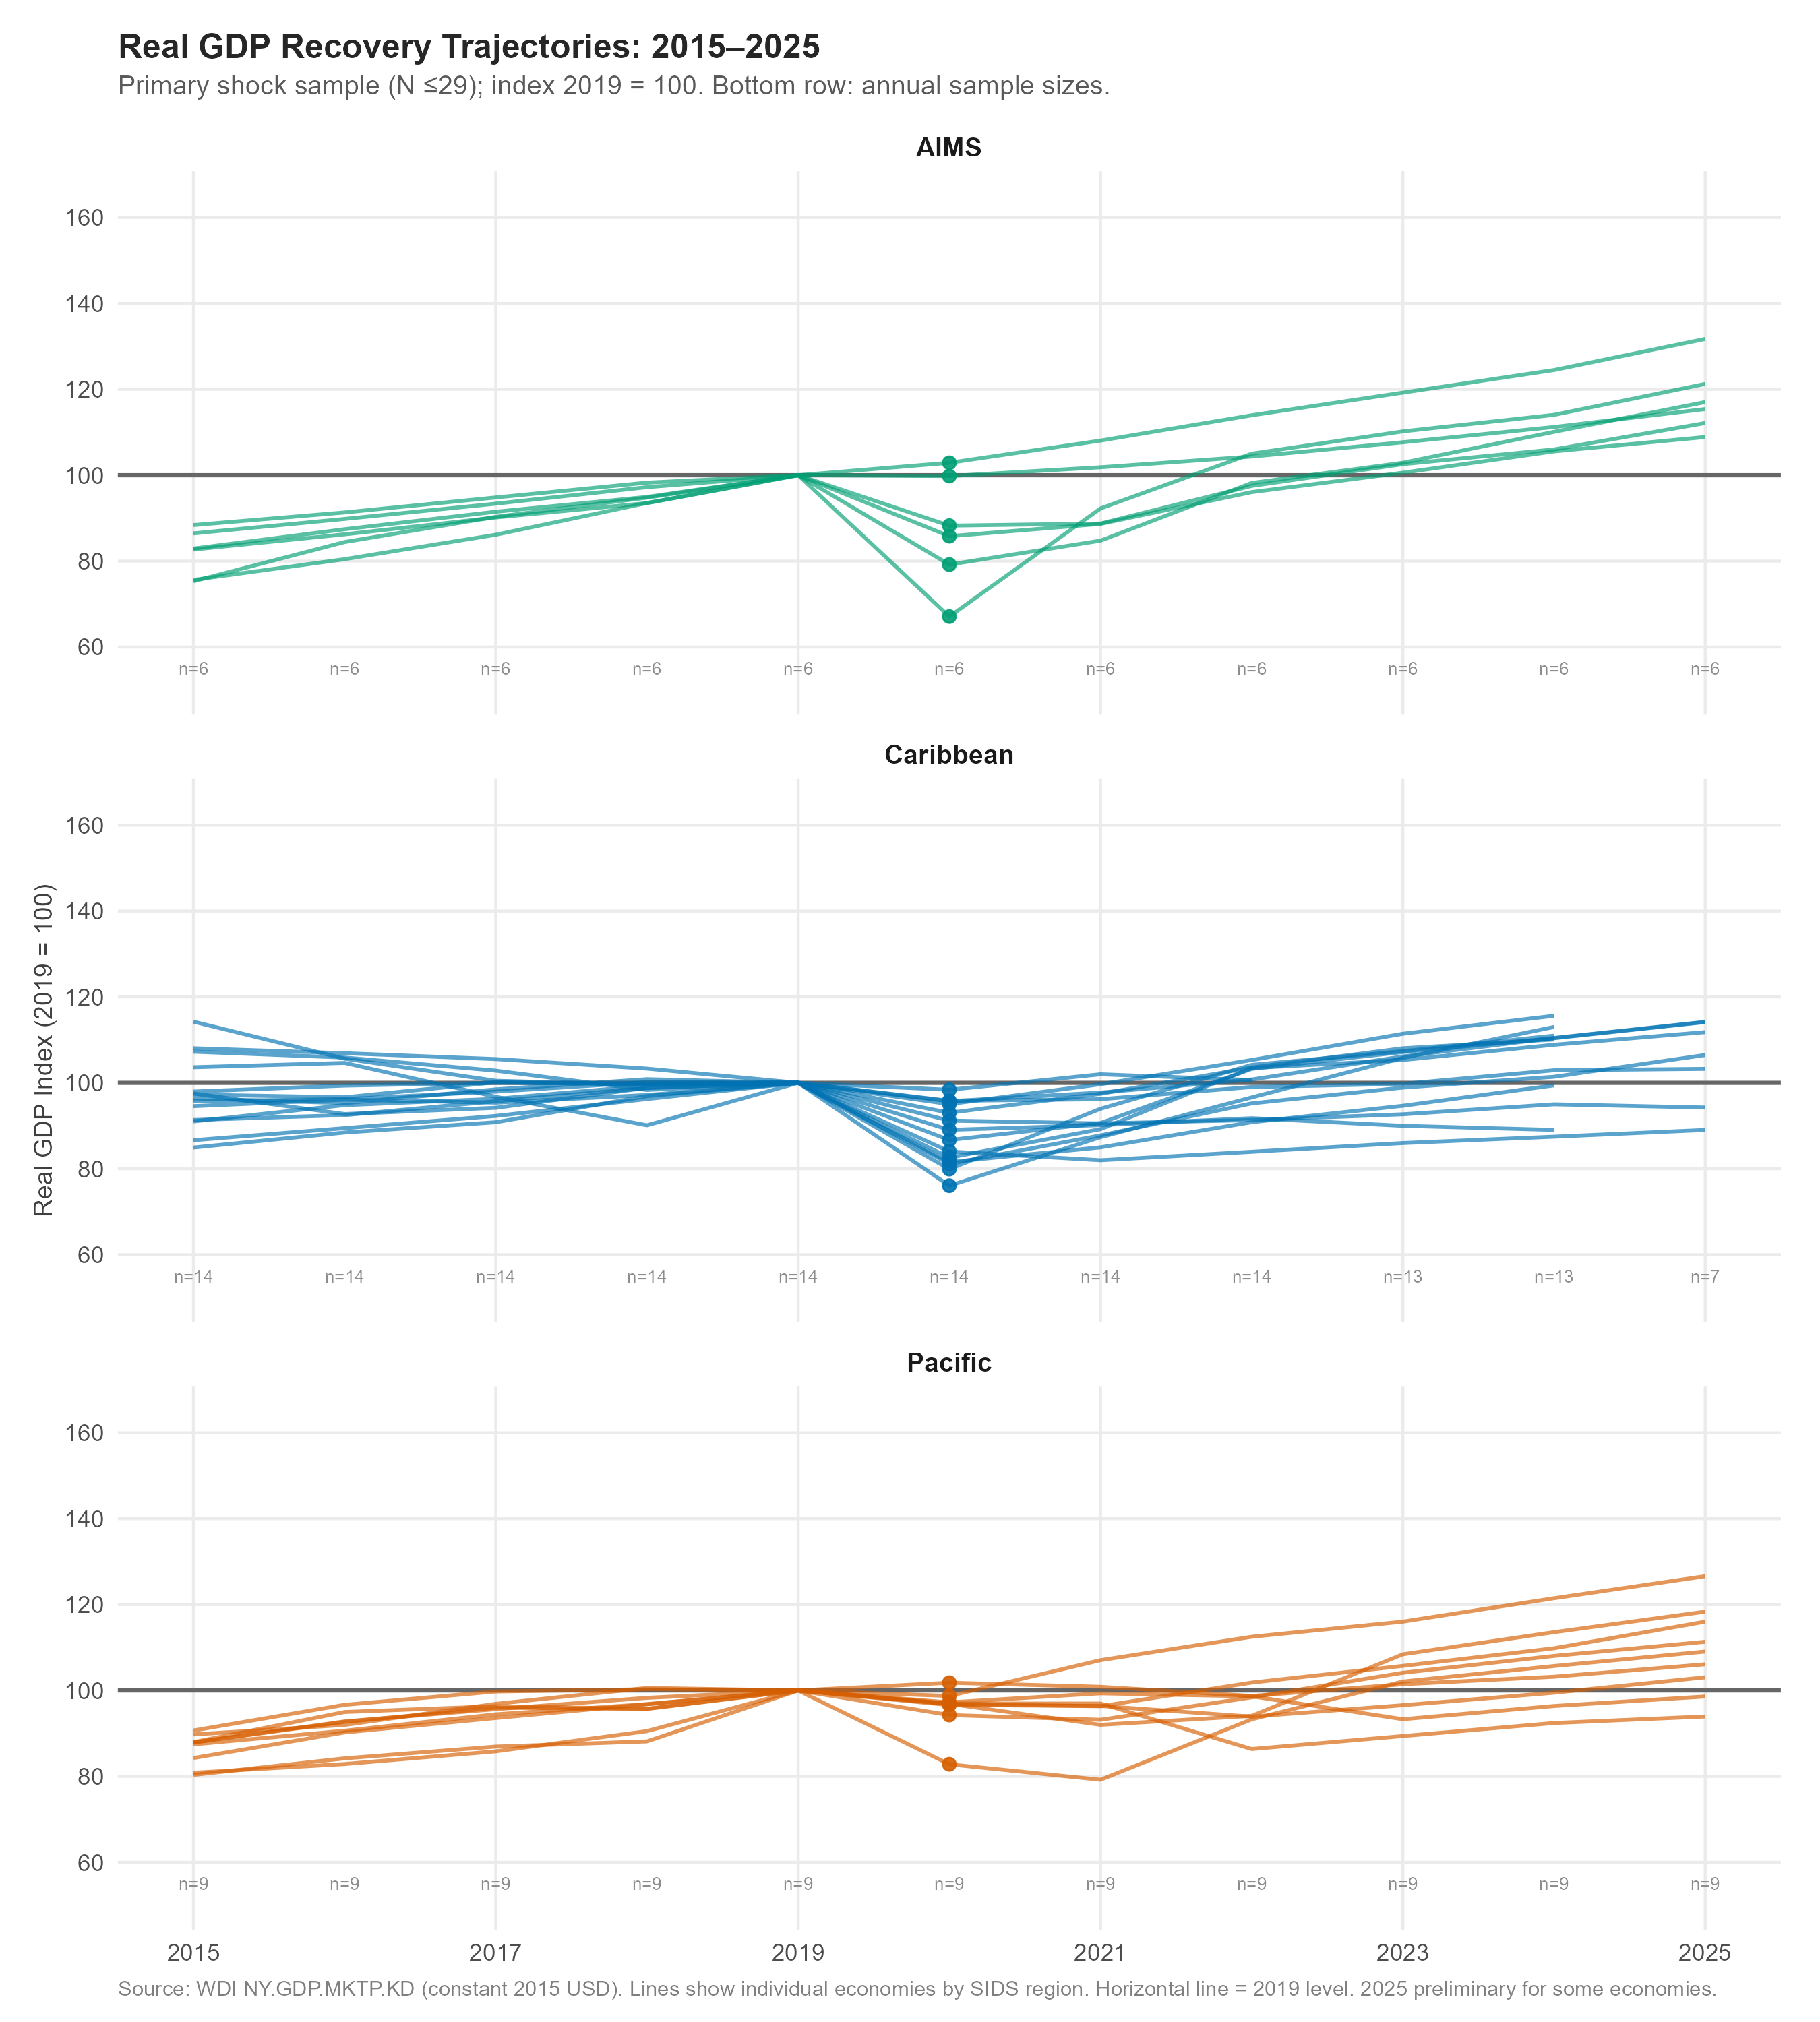
Recovery status by 2024
| ISO3 | Economy | Region | 2020 (shock) |
GDP idx 2024 |
GDP/cap idx 2024 |
Agg. recovered |
Per-capita recovered |
|---|---|---|---|---|---|---|---|
| COM | Comoros | AIMS | 99.8 | 111.2 | 100.9 | Yes | Yes |
| CPV | CapeVerde | AIMS | 79.2 | 110.1 | 107.8 | Yes | Yes |
| GNB | Guinea-B. | AIMS | 102.9 | 124.5 | 111.3 | Yes | Yes |
| MDV | Maldives | AIMS | 67.1 | 114.1 | 105.4 | Yes | Yes |
| MUS | Mauritius | AIMS | 85.8 | 105.6 | 107.3 | Yes | Yes |
| SYC | Seychelles | AIMS | 88.3 | 106.0 | 85.3 | Yes | No |
| ABW | Aruba | Caribbean | 76.1 | 113.0 | 114.3 | Yes | Yes |
| ATG | Antigua | Caribbean | 81.1 | 101.4 | 98.8 | Yes | No |
| BHS | Bahamas | Caribbean | 79.9 | 111.0 | 109.2 | Yes | Yes |
| BMU | Bermuda | Caribbean | 93.0 | 110.1 | 109.2 | Yes | Yes |
| BRB | Barbados | Caribbean | 82.6 | 108.9 | 108.4 | Yes | Yes |
| CUB | Cuba | Caribbean | 89.1 | 89.0 | 90.9 | No | No |
| CUW | Curacao | Caribbean | 81.6 | 99.4 | 100.4 | No | Yes |
| CYM | Cayman Is. | Caribbean | 95.0 | 115.6 | 104.5 | Yes | Yes |
| PRI | Puerto Rico | Caribbean | 95.8 | 102.9 | 106.1 | Yes | Yes |
| SUR | Suriname | Caribbean | 84.0 | 87.5 | 83.5 | No | No |
| SXM | Sint Maarten | Caribbean | 86.7 | 110.4 | 102.8 | Yes | Yes |
| TTO | Trinidad | Caribbean | 91.2 | 95.0 | 94.7 | No | No |
| VCT | St.Vincent | Caribbean | 95.7 | 110.5 | 114.4 | Yes | Yes |
| VIR | US VI | Caribbean | 98.4 | NA | NA | NA | NA |
| FJI | Fiji | Pacific | 82.8 | 105.7 | 104.1 | Yes | Yes |
| KIR | Kiribati | Pacific | 98.7 | 121.5 | 111.9 | Yes | Yes |
| MHL | Marshall Is. | Pacific | 97.2 | 96.4 | 113.0 | No | Yes |
| PNG | Papua NG | Pacific | 96.8 | 109.8 | 99.8 | Yes | No |
| SLB | Solomon Is. | Pacific | 96.6 | 99.5 | 88.4 | No | No |
| TON | Tonga | Pacific | 101.8 | 103.2 | 104.7 | Yes | Yes |
| TUV | Tuvalu | Pacific | 97.0 | 92.4 | 101.4 | No | Yes |
| VUT | Vanuatu | Pacific | 94.3 | 108.0 | 96.2 | Yes | No |
| WSM | Samoa | Pacific | 96.9 | 113.6 | 109.3 | Yes | Yes |
Recovery vs. tourism dependence
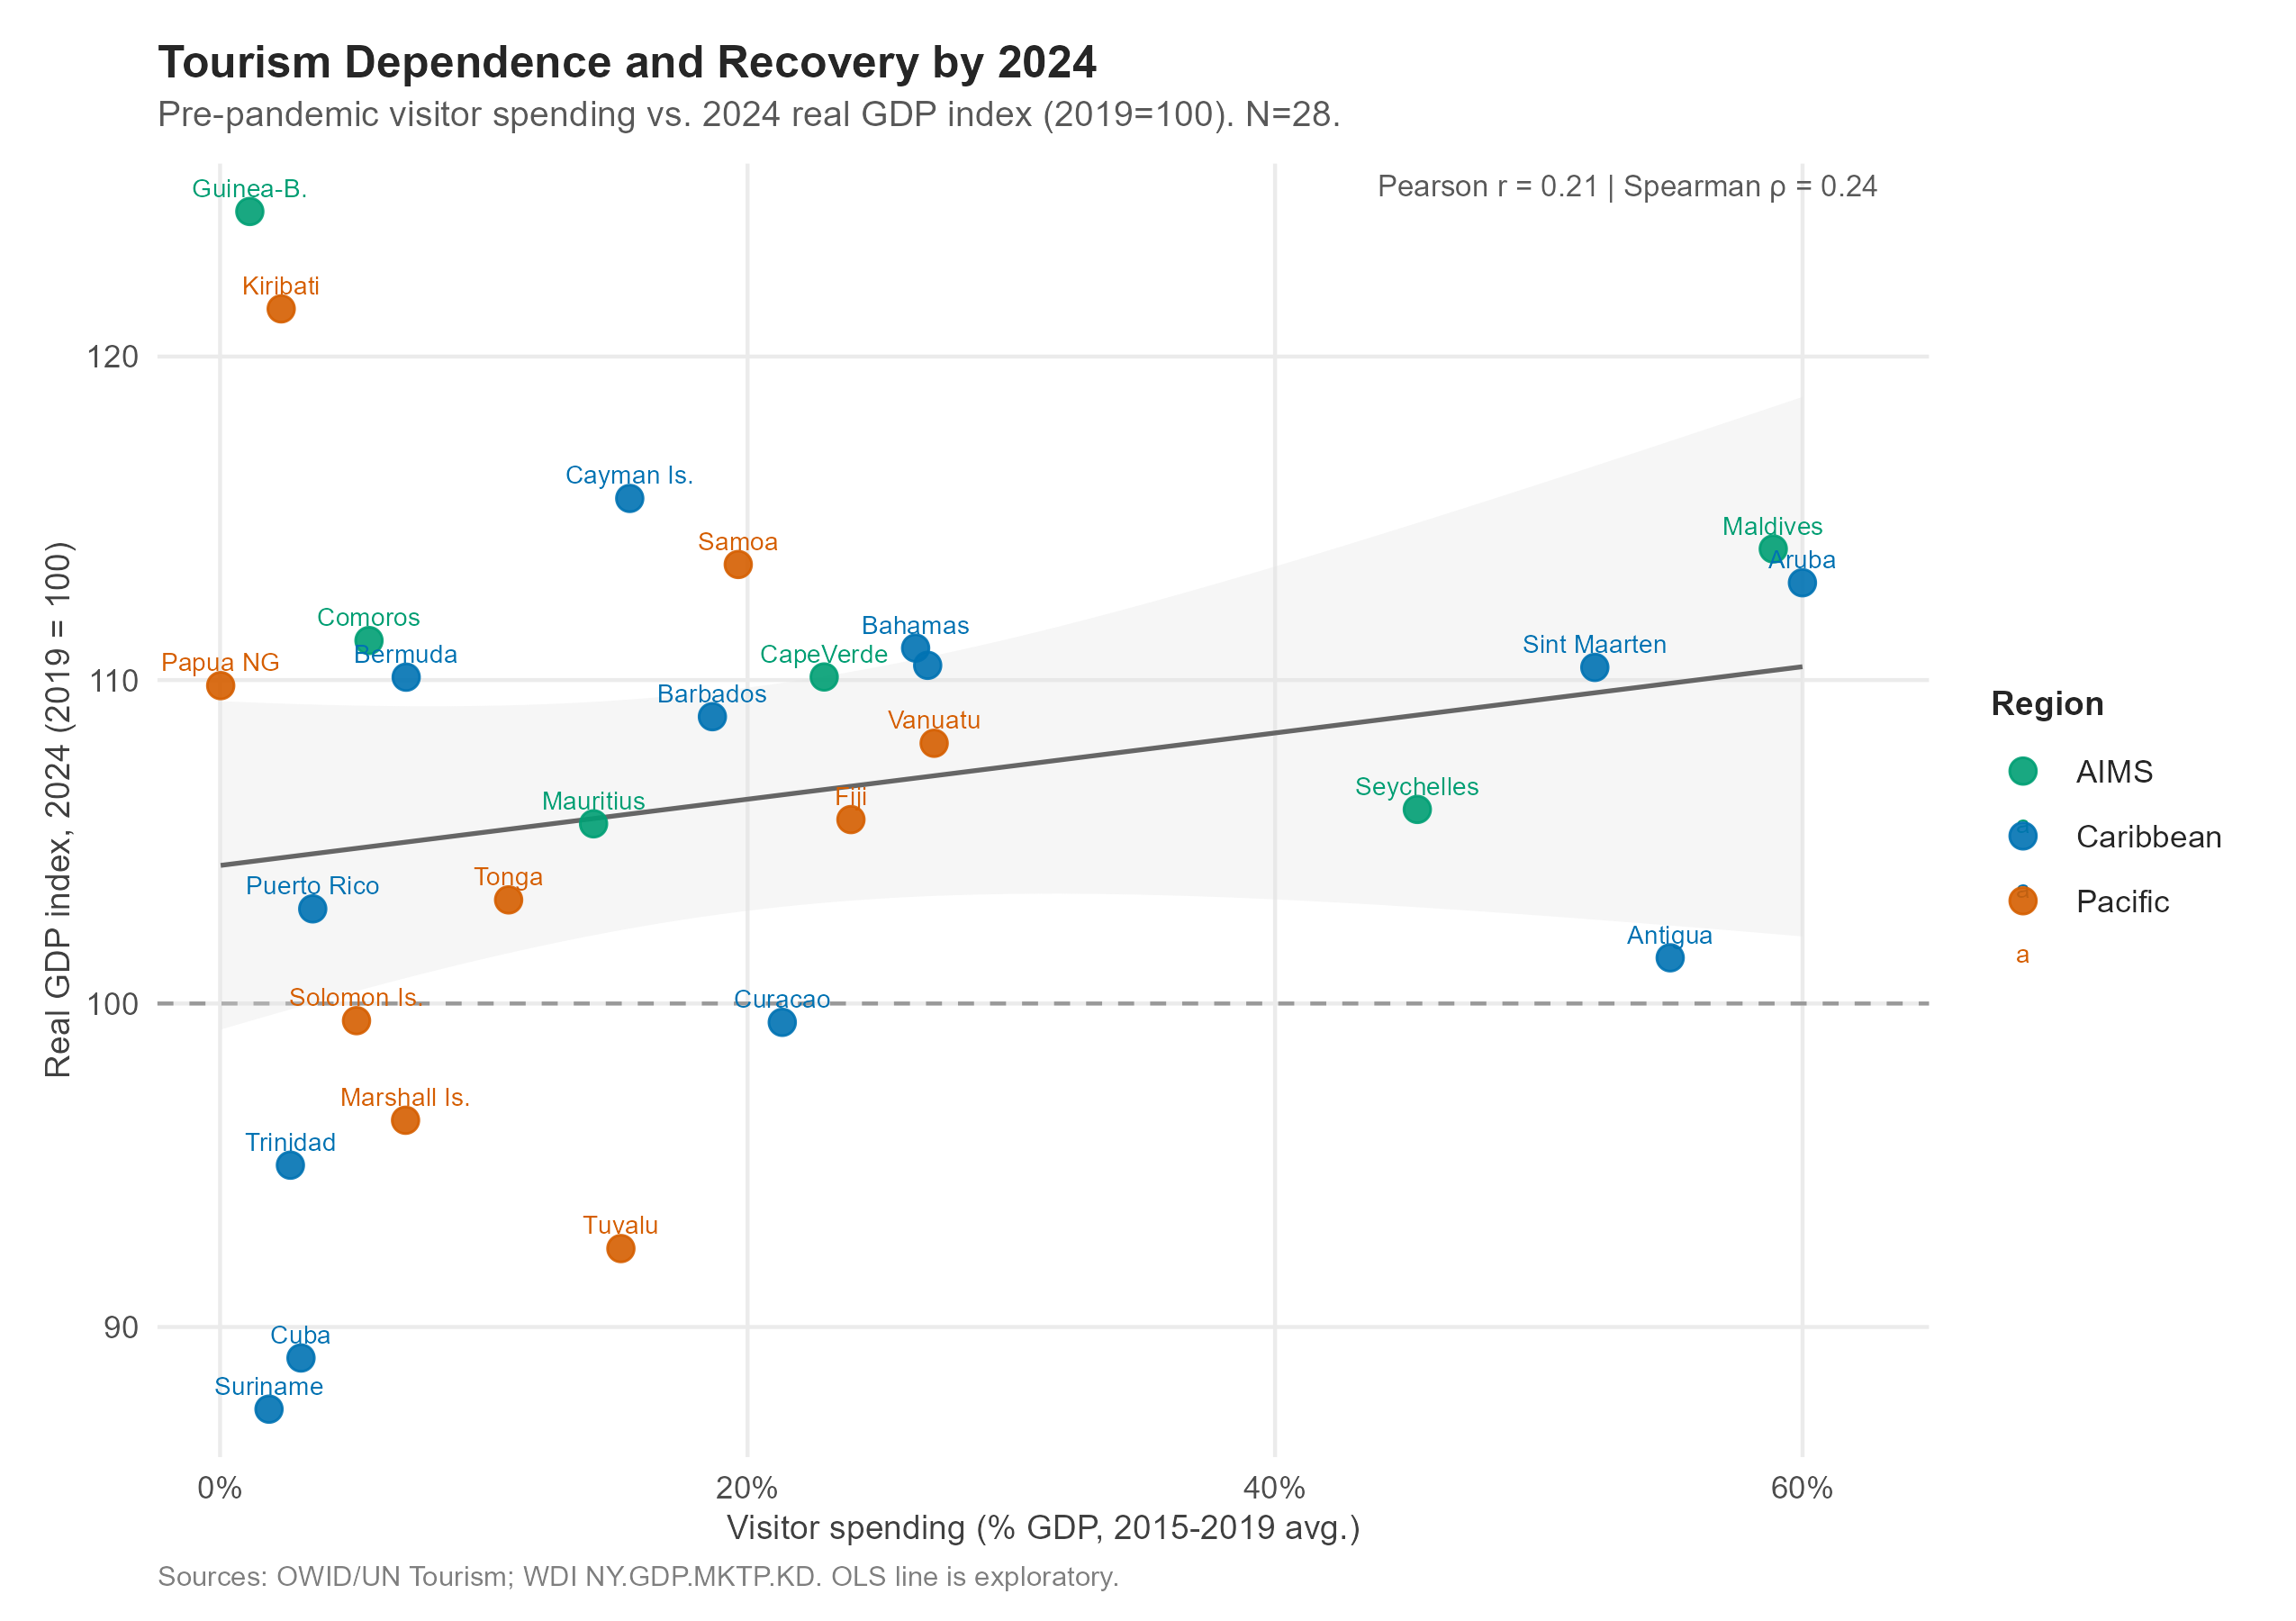
The absence of a significant association between pre-pandemic tourism dependence and the 2024 recovery index (Figure 6) does not mean tourism dependence was harmless or that the initial shock was inconsequential for these economies. Rather, the relationship between pre-pandemic exposure and longer-term economic recovery is not straightforward. Although tourism-dependent economies experienced particularly severe contractions in 2020, their subsequent recovery trajectories varied. By 2024, the degree of pre-pandemic tourism dependence alone did not explain which economies had regained their 2019 aggregate GDP levels.
Per-capita recovery provides a more nuanced picture. By 2024, 20 of 28 economies had recovered their 2019 real GDP per capita, compared with 21 of 28 for aggregate GDP. The difference illustrates why aggregate output alone can overstate the extent of economic recovery: an economy may regain its total output while remaining below its pre-pandemic level on a per-person basis. Population growth is one possible contributor to this divergence, although this analysis does not isolate its effects.
See Data Dictionary for source documentation and Methodology for research design.