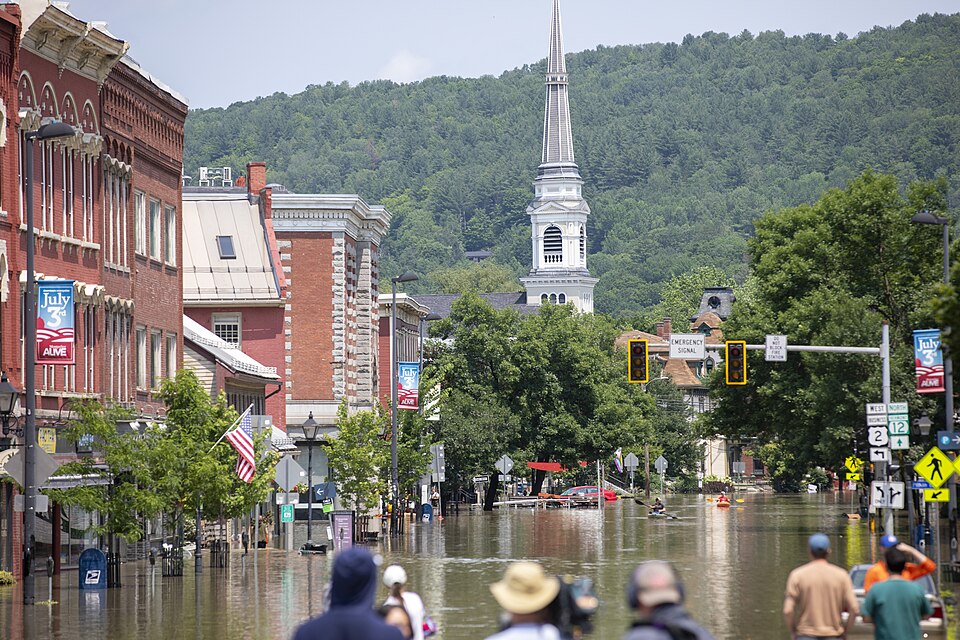
Flooding in downtown Montpelier, Vermont, July 2023. Credit: Vermont
National Guard /
Wikimedia Commons, public domain.
Floodlines
Risk is not equally distributed. Neither is the money to address it.
This dashboard compares flood risk, social vulnerability, and FEMA
mitigation funding across Vermont's towns to explore how closely funding
aligns with modeled need.
More than half of Vermont towns have never received FEMA Hazard Mitigation
Assistance funding. Many rank among the state's highest-need communities.
“It’s just a different world, in terms of the river, than we
were thinking about even 20 or 30 years ago.”
How to Read This Map
The default view compares flood need against mitigation funding
received. Towns are grouped into quadrants showing whether funding and
need appear aligned, and where they diverge. Can we identify high-risk
places before they become disaster statistics?
Use the model selector to compare three different measures of risk:
total expected loss, expected loss per resident, and FEMA's National
Risk Index. While rankings shift across models, the broader pattern
remains similar.
Metric:
Reactive benchmark — National Flood Insurance Program (NFIP)
claims show where insured losses occurred, not where future risk is
greatest. This layer is not part of the need model.
Model:
Measurement choices reshape the geography of need.
FEMA’s National Risk Index already incorporates risk, social
vulnerability, and community resilience — Risk and Vulnerability
overlays are disabled for this model to avoid double-counting.
Show Metric As:
Statewide PercentileCompared to VT Avg
Context Layers:
How to think about the metrics
Risk asks: Where could flooding cause damage?
Vulnerability asks: Who would have the hardest time recovering?
Combined Need asks:
Who faces serious exposure and has limited capacity to
recover?
Funding Gap compares modeled need against FEMA mitigation funding history.
Flood Risk
Expected annual flood loss — a dollar estimate of damage per year based
on local hazard intensity and property exposure. Higher rank = greater
expected damage.
Vulnerability
A composite of demographics that shape recovery capacity: poverty, age,
and access to transportation. Higher rank = harder to bounce back after
a flood.
Combined Need
A combined measure of flood risk and social vulnerability. Towns with
high need face both significant exposure and limited capacity to recover
without outside support.
Mitigation Funding
Flood-related FEMA Hazard Mitigation Assistance grants received since
1990, including both disaster-triggered and competitive mitigation
programs.
Funding Gap
The difference between a town's need rank and its funding rank. A larger
gap means a town ranks much higher on need than on funding received.
NFIP Claims per Capita
Inflation-adjusted NFIP insurance payouts per resident since 1989. This
is a reactive benchmark. Unlike the other metrics, NFIP claims
measure where flood damage has already occurred, not where future risk
is greatest. Compare this layer against Flood Risk to see how closely
funding follows past damage versus projected exposure.
Quadrants
Each town is placed in one of five categories based on its relative need
and funding record — from communities where investment aligns with
modeled need, to those with no recorded mitigation funding at all.
Town Population
Total population. Provides context for interpreting risk and funding
levels. Higher values indicate more populated towns.
Funding Totals
Total mitigation funding received, represented as bubble size. Larger
bubbles indicate more funding.
River Corridors
River corridors defined by State of Vermont ANR. Shaded areas show
mapped flood-prone river corridors. Many underserved towns overlap these
high-risk zones.
Total Risk (Expected Annual Loss)
Expected annual loss in dollars. Larger towns with more infrastructure
tend to score higher. Asks: who loses the most?
Risk per Person (Expected Annual Loss per Capita)
Expected annual loss divided by population. Surfaces small,
high-exposure towns that total-loss models obscure. Asks: who is most
at risk relative to their size?
FEMA National Risk Index
FEMA’s National Risk Index combines hazard exposure, social
vulnerability, and community resilience into a single composite
measure, standardized at the national level.
Town Snapshot
The map shows statewide comparisons. This panel shows detailed local
values.
Note: rankings shift when you change the risk model.
No permanent residents — index scores unavailable.
Risk & Exposure
statewide flood risk percentile
the state average
land area within river corridors
expected annual flood loss
expected annual flood loss
per resident
residents
Social Vulnerability
statewide vulnerability percentile
residents below poverty
residents age 65+
households without a vehicle
median household income
renter-occupied housing
Funding
statewide funding percentile
total mitigation funding
funding per resident
NFIP claims per resident
Need vs Funding
overall need percentile
state average per-resident
funding
funding alignment gap
Flood Mitigation Funding vs. Relative Need
Model: Total Risk (Expected Annual Loss)
Funding shows only a weak relationship with total expected flood loss.
A handful of high-loss communities receive substantial grants, but
many similarly exposed towns do not.
Model: Risk per Person (Expected Annual Loss per Capita)
Adjusting for population reshuffles the geography of need. Smaller,
highly exposed communities rise in the rankings, yet funding patterns
change relatively little.
FEMA National Risk Index
FEMA's own composite risk benchmark produces a similar pattern.
Funding remains only weakly aligned with measured risk across towns.
Axes show percentile rankings relative to other Vermont towns, not raw
dollar values or FEMA scores; bubble size represents population. If
funding closely tracked measured need, points would cluster along a
diagonal.
All dollar amounts are inflation-adjusted to 2025 dollars using the
Consumer Price Index (CPI-U, FRED).
Funding reflects
FEMA Hazard Mitigation Assistance (HMA) only — state
grants, USDA, HUD/CDBG-DR, FEMA IHP, and other local or federal
sources are not included.
Only
approved projects localizable to a specific town are
included. County-wide, regional, and statewide projects (~37% of
filtered HMA spending) are excluded, as are planning and
administrative costs.
HMA amounts reflect the federal share obligated (~75% of total project
cost); full public investment is higher.
NFIP claims reflect insured losses only. With fewer than 2% of Vermont
housing units covered by NFIP policies, claims data systematically
underrepresents flood exposure statewide.
Risk metrics (EAL and NRI) are modeled estimates of expected future
loss and exposure, not measures of cumulative historical damage.