Flooding in downtown Montpelier, Vermont, July 2023. Credit: Vermont
National Guard /
Wikimedia Commons, public domain.
Floodlines
Technical Appendix
Executive Summary
Floodlines integrates FEMA, Census, NFIP, and Vermont geospatial
datasets to estimate relative flood mitigation need across Vermont
municipalities. Need is modeled as a combination of flood exposure and
social vulnerability. Funding alignment is evaluated by comparing FEMA
mitigation investments against modeled need. The analysis finds that
funding is only weakly associated with modeled structural need and more
strongly associated with historical flood losses, suggesting a
predominantly reactive allocation pattern.
Key Findings
Need and funding exhibit weak correlation.
NFIP claims are substantially more predictive of funding.
Roughly half of Vermont municipalities received no FEMA mitigation
funding.
Findings are stable across normalization methods and model
specifications.
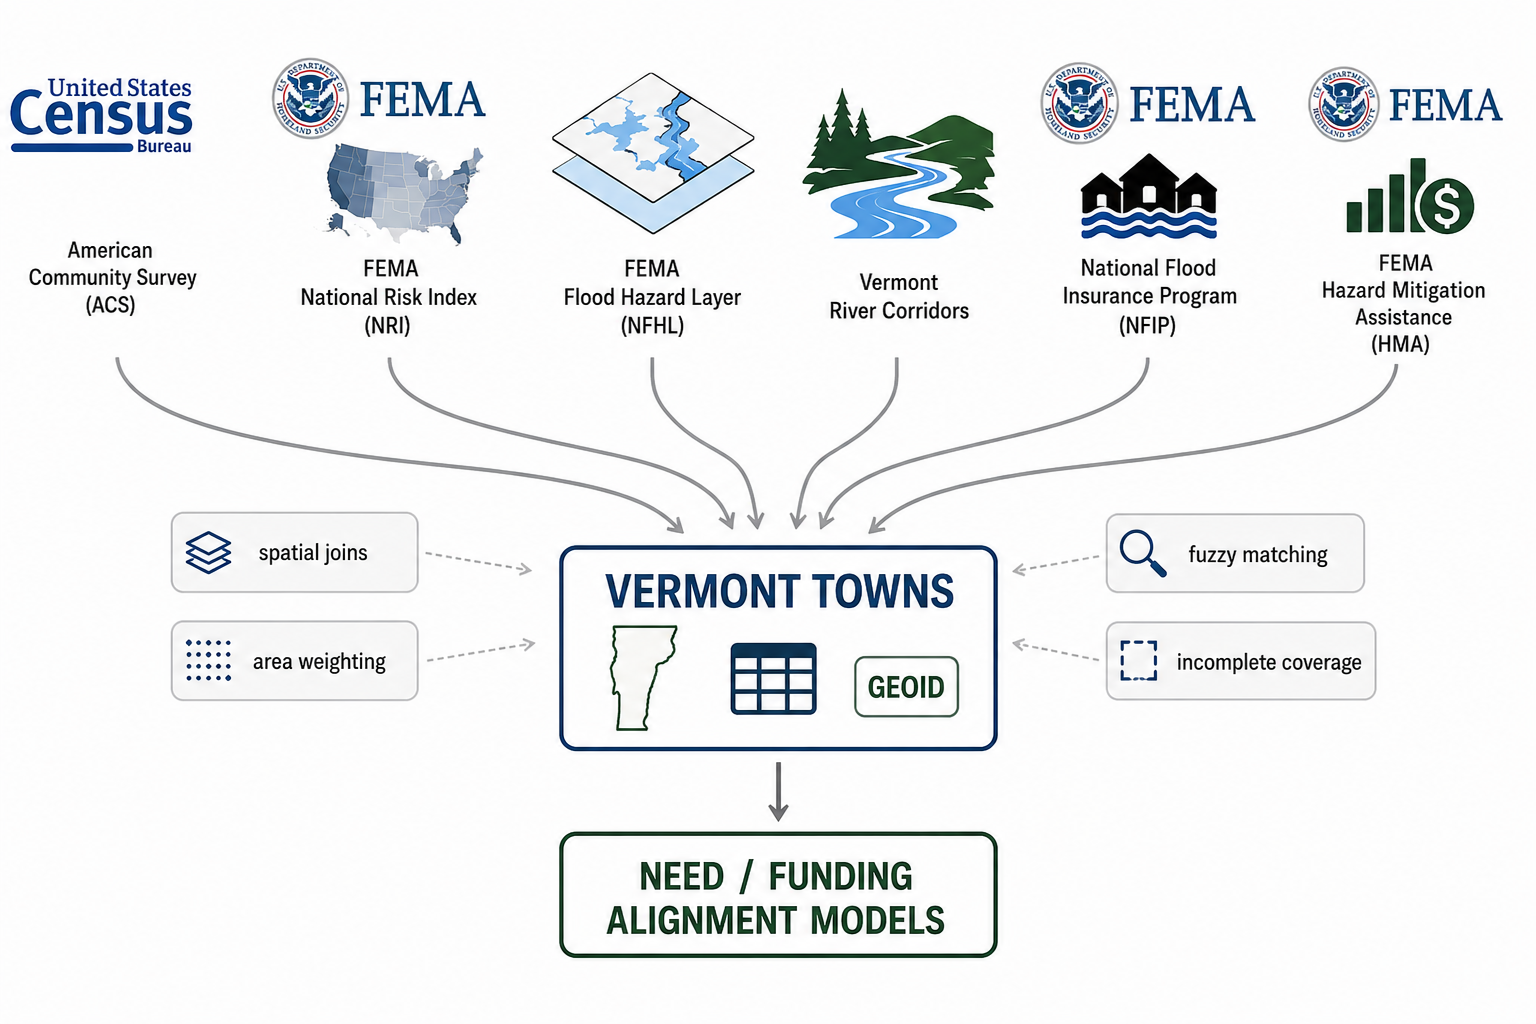
Data sources and analytical workflow used in this study. Federal
hazard, insurance, demographic, and mitigation datasets are integrated
at the municipal level and transformed into comparative measures of
need, funding, and funding alignment.
Research Question
This analysis evaluates whether flood mitigation funding in Vermont
aligns with underlying need. “Need” is treated as a normative construct
(what funding should target), while observed funding patterns reflect
real‑world allocation dynamics.
All spatial datasets were standardized to an equal‑area coordinate
system (EPSG:5070) for accurate area calculations, then
converted to WGS84 (EPSG:4326) for web mapping.
Flood exposure was estimated by calculating the percent of each town’s
land area within:
FEMA high‑risk flood zones (NFHL)
State‑defined river corridors
NFHL coverage varies across the state; a coverage flag was included to
account for incomplete mapping.
NRI Aggregation
FEMA NRI data (census tract level) were spatially intersected with
town boundaries.
Tract values were allocated to towns using area‑weighted proportions;
sliver overlaps (<1%) were removed and weights renormalized.
Aggregated metrics include Expected Annual Loss (EAL), population,
building and agricultural value, and composite
risk/vulnerability/resilience indices.
ACS Socioeconomic Data
Multiple ACS tables were cleaned and merged using GEOID identifiers.
Key indicators were calculated per Census guidance (percent below
poverty, percent elderly, percent without vehicle access).
Margins of error (MOE) were retained and propagated where appropriate.
FEMA HMA Funding Data
Project‑level funding was inflation‑adjusted to 2025 dollars using CPI
(FRED) and filtered to flood‑related mitigation projects.
Projects were assigned to towns using regex parsing, manual mapping,
and fuzzy matching for ambiguous cases.
Town‑level aggregates: total funding, funding per capita & per housing
unit (log‑transformed), and funding by period (pre‑2011, 2011–2022,
2023+).
NFIP Claims and Policies
Claims and policies were cleaned and matched to towns; claims were
inflation‑adjusted and aggregated by town and period.
Insurance penetration rates were calculated from active policy counts.
Final Dataset
All datasets were merged at the town level using GEOID and town name;
consistency checks ensured alignment across population and housing
variables.
The final dataset includes all Vermont towns, including those with
zero funding.
Need Index Construction
A composite need index was developed to estimate relative flood
mitigation need across towns.
Components
Risk (Exposure): primary measure was Expected Annual
Loss (EAL) from FEMA NRI.
Variables were evaluated using both z-score and rank-based
normalization; rank-based normalization was selected for all published
indices.
Risk and vulnerability composites were combined with equal weighting
in models containing both components.
Rationale
EAL was selected as the primary risk variable for its multidimensional
loss capture. A parsimonious set of vulnerability variables preserves
interpretability while retaining signal.
Model Evaluation
Robustness Checks
Need indices were highly consistent across normalization methods
(Spearman correlation ≈ 0.91–1.00).
Rankings were stable with modest variation at the extremes.
Sensitivity Analysis
Leave‑One‑Variable‑Out (LOVO): tested how removing
each variable affected rankings and underfunded town identification.
Weight Variation: tested alternative weightings
(e.g., 70/30, 30/70 risk vs. vulnerability).
Key result: the model is robust to weighting; the choice of risk
variable (EAL vs. exposure) is most consequential.
Finding: EAL‑based models are more stable and policy‑relevant;
additional variables provide limited extra explanatory power.
Normalization Choice
Rank-based normalization was used for all published indices rather than
z-scores.
Vermont flood and funding data are highly skewed, with extreme
outliers compressing z-score distributions.
Rank normalization produces bounded, interpretable values relative to
peer towns.
Variables with different units and distributions (EAL, flood exposure,
socioeconomic indicators) can be compared on a common scale without
distributional assumptions.
Sensitivity testing showed minimal substantive difference between
rank-normalized and z-score models; town rankings remained highly
consistent across methods.
Model Selection
Three models were selected for the web analysis based on complementary
strengths in predictive signal, stability, and external
benchmarkability:
EAL-based model – primary analytical model; strongest
ability to predict funding access.
EAL per capita model – robustness check; most stable
across normalization methods.
FEMA NRI model – external benchmark using FEMA’s own
composite risk framework.
Funding Alignment Analysis
Gap Index
Gap = normalized need − normalized funding per capita (log-scaled).
Positive values indicate underfunding relative to need; negative values
indicate overfunding.
Observed: moderate positive correlation with need (~+0.32 to +0.49),
indicating the index captures allocation mismatch rather than simply
re‑labeling need.
Correlation Analysis
Need vs. funding: weak correlation (~0.10–0.30).
Claims vs. funding: stronger correlation (~0.55), suggesting funding
aligns more with past damage than forward‑looking need.
Regression Analysis
Logistic regression (funding access): AUC ≈ 0.6–0.8 (moderate ability
to predict which towns receive funding).
OLS models using log-transformed funding per capita produced near-zero
explanatory power (R² ≈ 0).
Interpretation: structural variables weakly explain who gets funding
and do not explain funding amounts.
Spatial Analysis
Moran’s I indicates significant spatial clustering of need.
Choropleth maps confirm geographic consistency of risk patterns;
funding does not exhibit the same alignment.
Quadrant Analysis
Towns were categorized by need and funding into zero funding,
underfunded (high need, low funding), aligned, overfunded, and low
priority groups.
~52% of towns received zero funding.
High‑need towns are overrepresented among underfunded and zero‑funded
groups; distribution across quadrants is consistent across model
specifications.
Key Findings
Flood mitigation funding exhibits weak alignment with modeled
structural need across Vermont municipalities.
Historical flood losses, as measured through NFIP claims, are
substantially more predictive of funding allocation than
forward-looking risk and vulnerability indicators.
Approximately half of Vermont towns received no FEMA Hazard Mitigation
Assistance funding, including numerous communities identified as
high-need under multiple model specifications.
The observed patterns are robust across alternative definitions of
need, normalization approaches, and sensitivity analyses.
Key Limitations
NFHL flood mapping is incomplete across Vermont (52%).
NFIP participation is extremely low (<2% of housing units),
limiting claims as a comprehensive risk proxy.
Town‑level aggregation may obscure within‑town variation.
Risk scores (EAL, NRI) are modeled annualized estimates, not
cumulative observed damage.
Funding data reflect approved projects only, not unmet demand or
unsuccessful applications.
Funding reflects only the federal share obligated under FEMA Hazard
Mitigation Assistance (HMA) localizable to a specific town.
County-wide, regional, and statewide mitigation projects could not be
reliably attributed to individual municipalities and were excluded
from town-level funding totals.
Reproducibility
All data sources used in this analysis are publicly available. Data
processing, model construction, sensitivity testing, and dashboard
generation scripts are available in the project repository.
Abbreviated Dashboard Data Dictionary
The interactive dashboard uses a flat town table
(town_stats.csv) and a simplified town GeoJSON to power
choropleths, charts, rankings, and town-level summaries. A complete
field-level data dictionary is available in the
project repository.
Identifiers & base attributes
GEOID: 10‑digit Census town FIPS identifier (primary join
key).
town_name: Standardized town label used in UI.
population: Total resident population (integer).
area_sq_km: Town land area (km²).
pct_river_corridor: Percent of town area inside state
river corridor polygons.
Core socioeconomic & exposure fields
pct_below_poverty, percent_elderly,
pct_no_vehicle, pct_renter_occupied,
median_income — socioeconomic indicators used to build the
vulnerability component shown in the vulnerability choropleth and stats
card. IFLD_EALT_weighted, EAL_per_capita — expected
annual loss (EAL) measures used as primary exposure/risk inputs.
Vulnerability composite
vulnerability, vulnerability_rank,
vulnerability_rel — composite (percentile‑rank mean of
poverty, elderly, no‑vehicle) used in the vulnerability choropleth and
as part of need.
Modeled indices (per‑model naming convention)
For each model suffix (examples used in export: eal,
eal_per_capita, nri) the dashboard expects the
following patterns:
risk_{model} — raw (0–1) risk index for the model.
risk_rank_{model} — percentile rank (0–1) of the risk
index.
risk_{model}_rel — relative-to-state risk (centered) used
to label “above/below state average.”
need_{model}, need_rank_{model},
need_{model}_rel — need index, rank, and relative metric.
gap_{model}, gap_rank_{model},
gap_{model}_rel — funding gap (need − funding), its rank,
and relative gap scaled to mean absolute gap.
quadrant_{model} — categorical quadrant for need vs
funding (zero_funding, underfunded,
aligned, overfunded,
low_priority).
Funding and NFIP fields
funding_total: Total FEMA mitigation funding obligated to
the town (inflation‑adjusted).
funding_per_capita: Funding / population (USD/person).
funding_rank, funding_rel: Percentile rank
and log‑based relative funding metric.
claims_paid_per_capita, claims_rank,
claims_rel: NFIP claims per person plus rank and relative
metric.
State summary row
The export appends a synthetic
town_name = "State of Vermont" row populated with
population‑weighted averages (and totals where appropriate) so the
dashboard can show statewide comparisons without extra aggregation.
Provenance & Notes
Export datasets, field definitions, and backend schemas are documented
in the
project repository.
Relative metrics are generally centered as
(x / x̄) − 1; gap metrics are scaled by mean absolute gap
to preserve sign and interpretability.
Percentile ranks (rank(pct=True)) are the canonical
comparison metric used throughout the dashboard.