Analyzed millions of bike-share trips with R, separating commuters from casual riders. Delivered insights that shaped strategies on pricing and retention—showing how the city moves when the data rides along.
Project Links
I built this project to refresh my R skills and ended up diving much deeper than planned. I’m a fan of biking, was born outside Chicago, and have long been curious about how bikeshare systems work. I didn’t need to analyze both 2019 and 2024—but once I got going, I couldn’t help myself. This is where I (finally) stumbled upon the obvious trick of turning my analysis notebooks into easy-to-read web pages—a game changer for presenting data work cleanly. I’m proud of the insights and polish on this one.
Project Overview
This project explores trip data from Cyclistic, a fictional bike-share company, to distinguish usage patterns between casual riders and annual members. The goal was to uncover trends that could inform a marketing strategy aimed at converting casual riders into long-term members.
Using R for data cleaning and analysis, I processed ride data for 2024 and 2019, identifying key differences in ride duration, trip frequency, and preferred stations. Visualizations highlighted actionable insights such as peak usage hours, seasonal trends, and geographic hotspots for casual riders.
Key findings, presented in an R Markdown report knitted into HTML, highlight significant variations in trip length, popular routes, and time-of-day preferences between user groups. These insights support targeted marketing efforts, such as promotional campaigns at high-traffic casual rider locations and pricing adjustments for specific time slots.
This project demonstrates my ability to perform data wrangling, statistical analysis, and visual storytelling, translating raw data into strategic business recommendations for Cyclistic’s membership growth initiatives.
Gallery
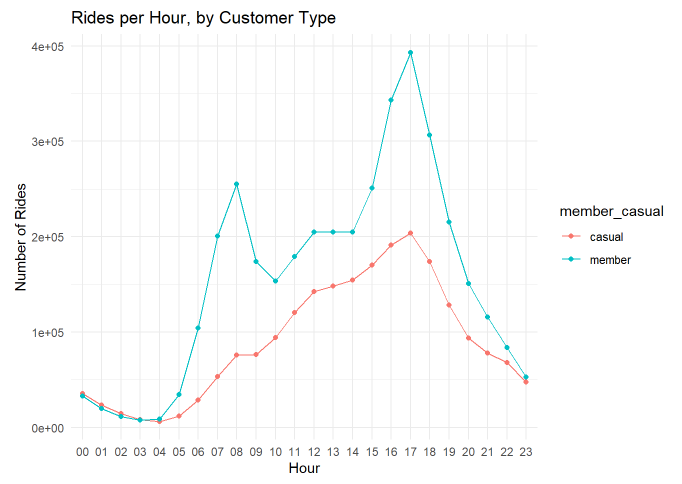 Rides per Hour (2024): Members show two peaks during commuting
hours, while casual riders peak in the late afternoon.
Rides per Hour (2024): Members show two peaks during commuting
hours, while casual riders peak in the late afternoon.
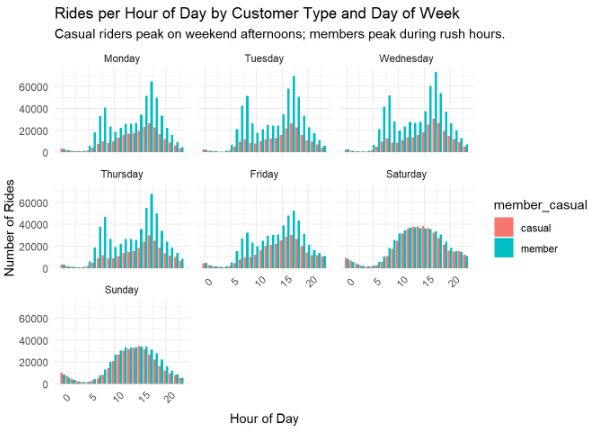 Rides by Hour & Day (2024): Members commute on weekdays; casual
riders increase on weekends, reflecting leisure patterns.
Rides by Hour & Day (2024): Members commute on weekdays; casual
riders increase on weekends, reflecting leisure patterns.
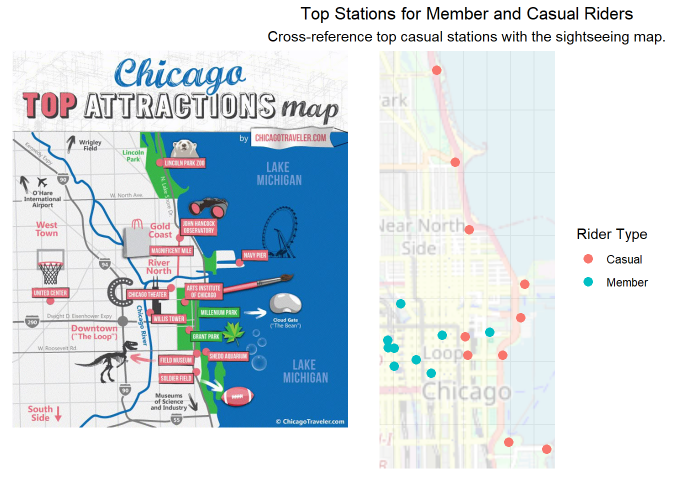 2019 Comparison Map: Casual rider hotspots align with Chicago’s
major tourist destinations and attractions.
2019 Comparison Map: Casual rider hotspots align with Chicago’s
major tourist destinations and attractions.
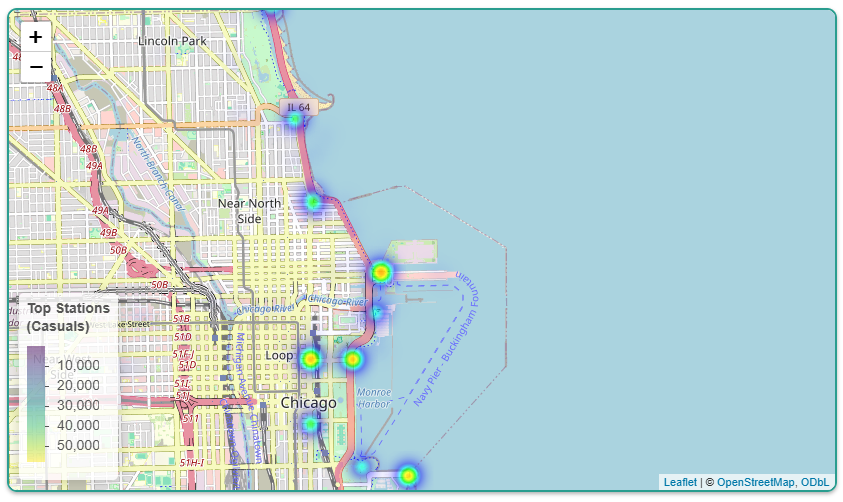 Casual Rider Stations (2024): High activity in neighborhoods near
the lakefront, parks, and cultural sites—Millennium Park, Museum
Campus, and Navy Pier.
Casual Rider Stations (2024): High activity in neighborhoods near
the lakefront, parks, and cultural sites—Millennium Park, Museum
Campus, and Navy Pier.
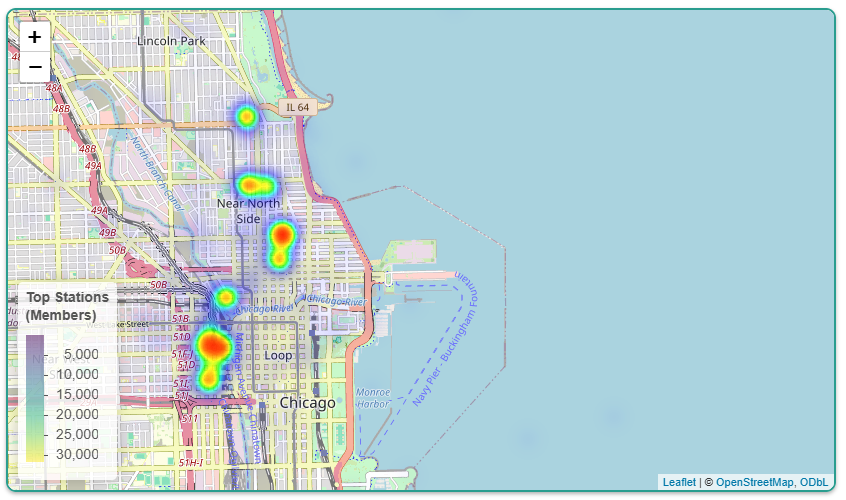 Member Stations (2024): Concentrated on The Loop and River North,
near transit hubs and dense commercial districts.
Member Stations (2024): Concentrated on The Loop and River North,
near transit hubs and dense commercial districts.
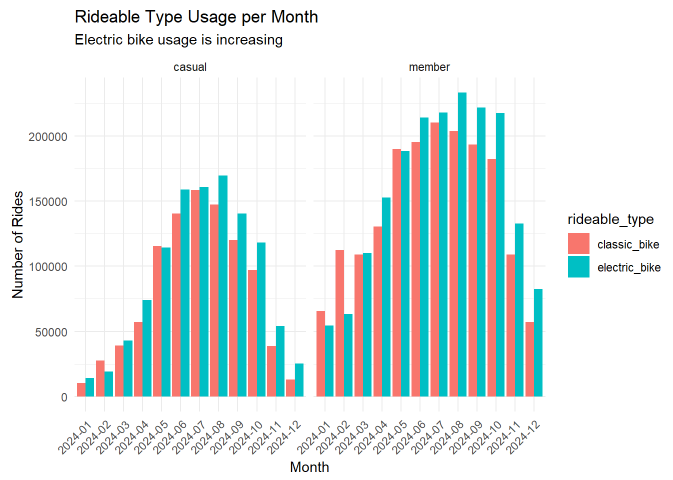 Rides by Bike Type & Month (2024): Electric bike usage is rising.
Overall ridership shows clear seasonal trends: higher in summer,
lower in winter.
Rides by Bike Type & Month (2024): Electric bike usage is rising.
Overall ridership shows clear seasonal trends: higher in summer,
lower in winter.
References
Dataset provided by Google, from Lyft and Divvy's Chicago operations. The data has been made available by Motivate International Inc. under this license.