A Plotly dashboard exploring microbial life in the navel. Quirky biology made visual—and a reminder that ecosystems exist as much inside us as outside.
Project Links
This first JavaScript dashboard of mine brought joy to my inner science nerd, combining old and new interests: science communication and data storytelling. Visualizing data from a public outreach project where volunteers swabbed their belly buttons, it lets users explore mini microbe profiles and ponder the invisible ecosystems we all carry around. The project celebrates citizen science and healthy microbes—and might just make you wash your belly button.
Project Overview
This dashboard explores microbial diversity using the Belly Button Biodiversity dataset, part of an NC State University public science project. The aim was to create an intuitive interface where users can explore different subjects’ microbial samples, highlighting the role of microbes in health and everyday life.
Built with Plotly, D3, and Bootstrap, the app includes interactive bar charts (top OTUs per subject), bubble charts (species distribution), and a gauge chart tracking belly button hygiene. It’s a playful but powerful example of making biological data visual, interactive, and publicly engaging.
Gallery
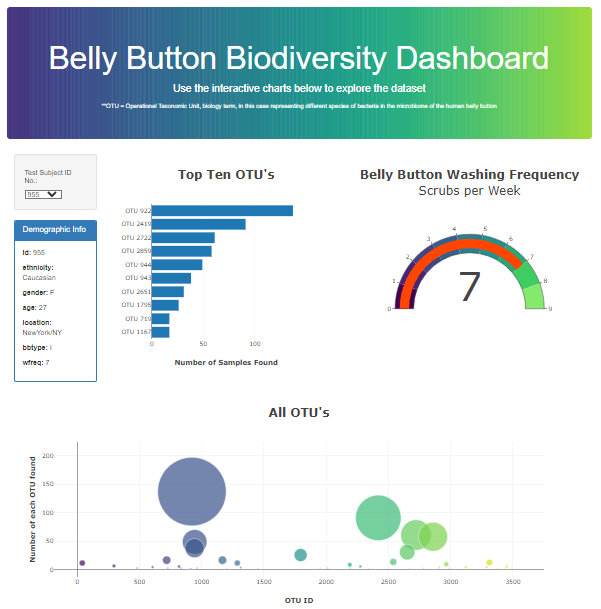 Belly Button dashboard: Visualizing the surprising biodiversity
of beneficial microbes found in our daily lives.
Belly Button dashboard: Visualizing the surprising biodiversity
of beneficial microbes found in our daily lives.
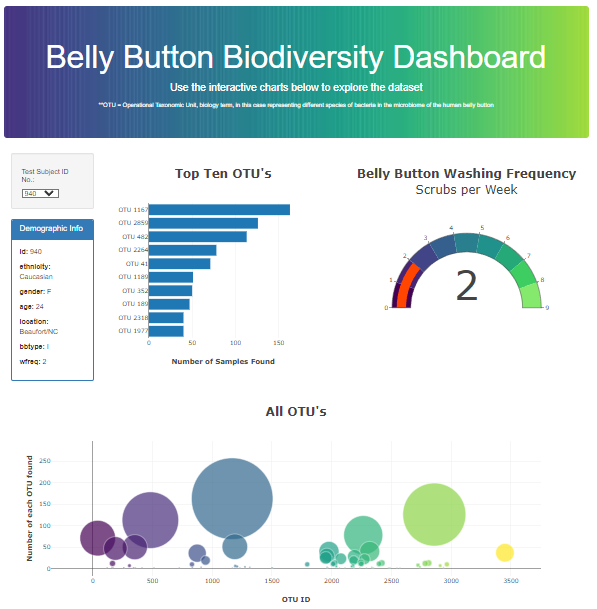 Alternate dashboard view: Demographic details, bar and bubble
charts of microbial populations, and a gauge tracking washing
frequency.
Alternate dashboard view: Demographic details, bar and bubble
charts of microbial populations, and a gauge tracking washing
frequency.
References
Dataset from the Belly Button Biodiversity Project.