Image generated by Microsoft Designer (Image Creator)
Cyclistic 2024: A Google Data Analytics Capstone
Cyclistic 2024: A Google Data Analytics Capstone
Understanding Ridership Patterns to Drive Membership Growth
Bryan Johns
March 2025
Cyclistic 2024 Final Report
A hypothetical data analysis project, answering a business question for a fictional bikeshare company, analyzing customer behavior, and concluding with recommendations to assist in converting casual customers into annual members.
Executive Summary
This report analyzes historical data on Cyclistic users to provide insights for a digital marketing campaign aimed at converting casual riders into annual members. Our findings suggest that casual riders use Cyclistic differently than members, and marketing strategies should leverage these behavioral patterns to drive conversions.
Key Findings
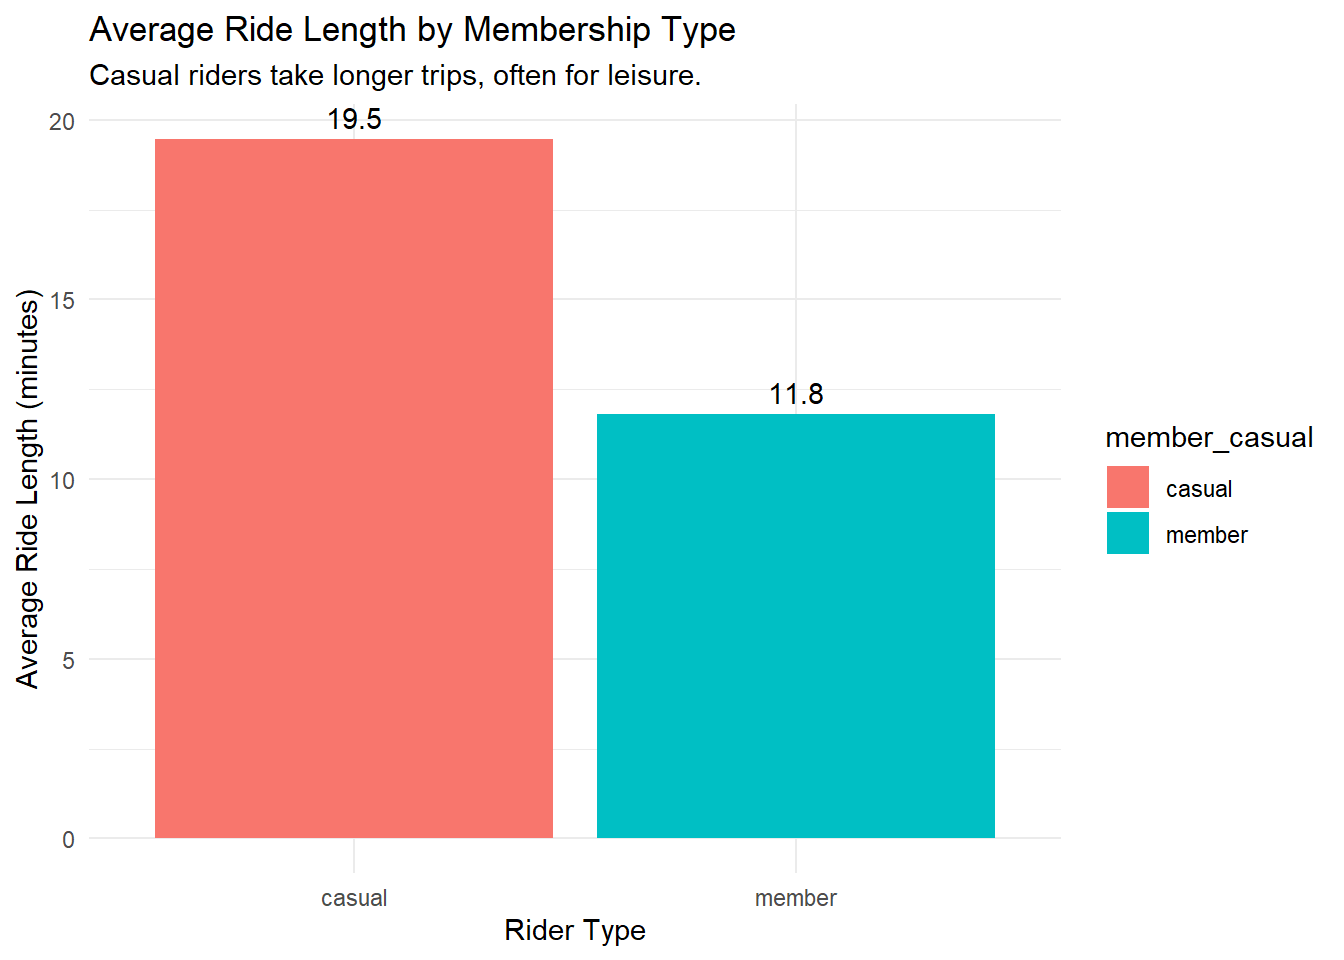
Casual riders use Cyclistic for leisure: Their rides are almost twice as long (~20 minutes) with peak traffic on weekends, particularly Saturday afternoons.
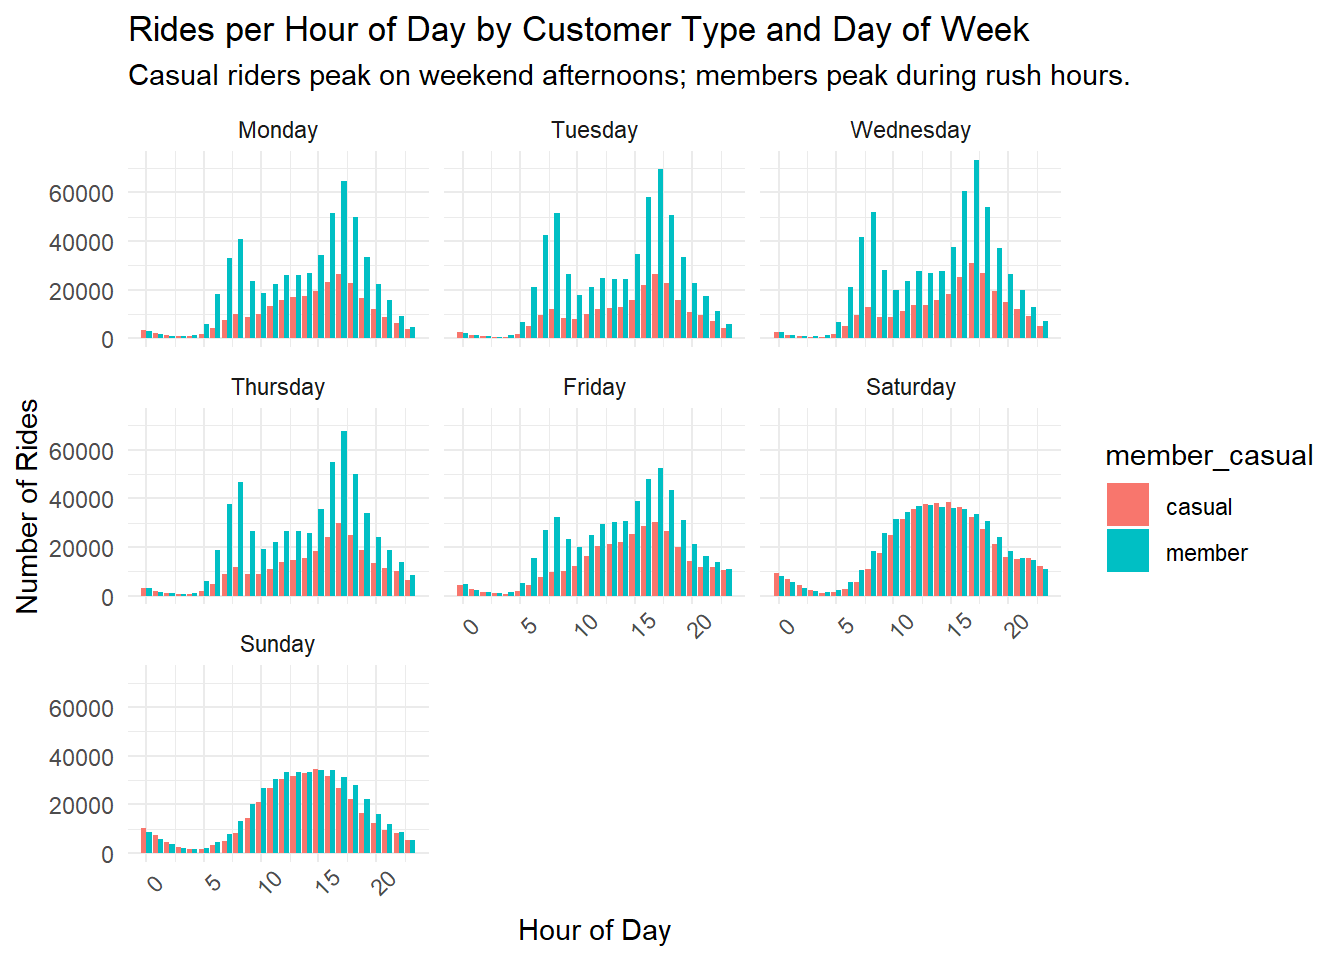
Annual members are predominantly commuters: Their rides are shorter (averaging under 12 minutes) and occur mainly during weekday commuting hours (8 AM and 5 PM).
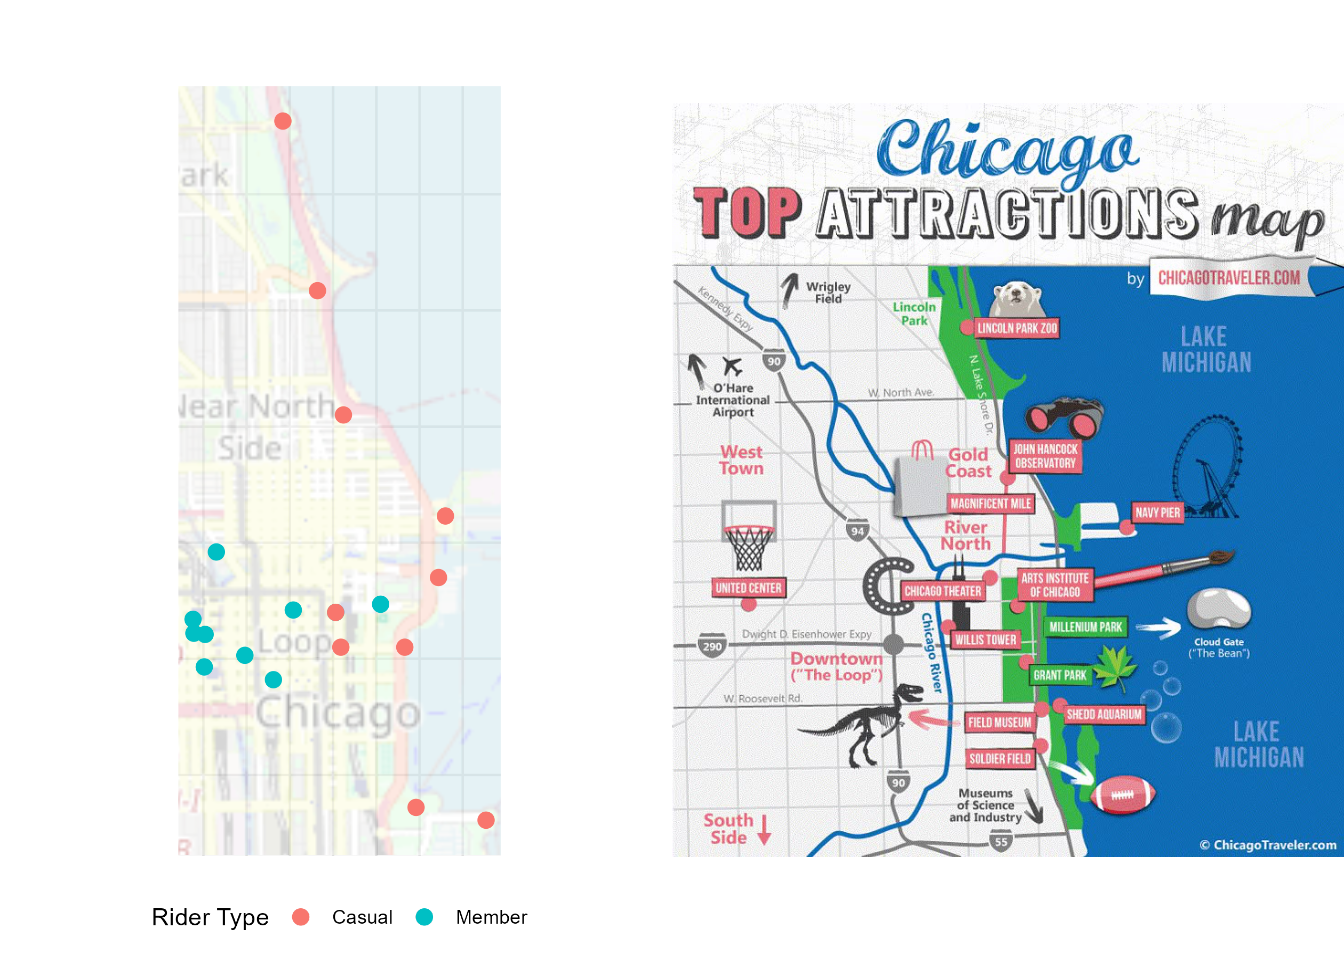
Location trends: Members’ trips are concentrated in downtown Chicago’s business districts, while casual riders favor popular leisure destinations.
Increasing electric bike usage: Both members and casual riders show a growing preference for electric bikes.
Key Visuals
Top 10 starting stations for member and casual rides
The above hotspots correspond to The Loop and River North, neighborhoods known for a dense concentration of offices, commerical establishments, and residential buildings. They include Ogilvie Transportation Center and Union Station, serving commuters transitioning between regional trains and local destinations.
The above hotspots correspond to The Loop, Streeterville, Gold Coast, Lincoln Park, and the Near South Side, neighborhoods known for their proximity to Chicago’s lakefront, parks, cultural institutions, and tourist attractions. These destinations include Millennium Park, Museum Campus, and Navy Pier, drawing visitors for sightseeing, entertainment, and recreational activities along Lake Michigan. Many locations offer scenic waterfront views, beach access, and connections to Chicago’s extensive bike path network.
Compare the above 2024 maps with 2019’s:
2019’s top member and casual stations, with a tourist sightseeing map.
Top Recommendations
Leisure-Focused Marketing: Position membership as a way to enhance casual riders’ existing leisure habits by emphasizing benefits, such as unlimited rides, extended ride times, and the convenience of electronic bikes.
Targeted Digital Advertising: Deploy ads on platforms frequented by casual riders, particularly those related to entertainment, travel, and dining, and use geo-targeted ads near high-traffic leisure stations.
Promotional Incentives: Offer weekend-focused memberships, seasonal discounts, referral bonuses, and strategic partnerships with major Chicago events and leisure attractions.
![]()
Methodology
.](resources/images/six_phases_of_data_analytics.png)
Image from the Google Data Analytics Professional Certificate.
This analysis follows the framework outlined in Google’s Data Analytics certificate, structured as follows:
- Ask: A clear statement of the business task – converting casual riders into annual members.
- Prepare: Use cleaned historical data from 2024, detailing trip durations, ride frequencies, and station locations.
- Process: Perform data cleaning, transformation, and exploratory analysis.
- Analyze: Identify behavioral trends and customer segment differences.
- Share: Provide key findings and supporting visualizations.
- Act: Deliver actionable marketing recommendations.
Ask
How do annual members and casual riders differ in their use of Cyclistic bikes, and how can this inform marketing strategies to convert casual riders into members?
Summary of the Business Case
Cyclistic, a bike-share company in Chicago, aims to increase its number of annual members, as they are more profitable than casual riders. Rather than targeting new customers, the marketing team wants to convert casual riders into annual members by understanding their riding behaviors.
To support this initiative, I have been assigned to analyze how annual members and casual riders use Cyclistic bikes differently. This analysis will identify key trends in usage patterns, which will inform marketing strategies designed to encourage casual riders to become members.
For reference, the full case study details can be found in the Appendix.
Data Sources
The analysis incorporates cleaned ride data from all 5,845,479 bike rides of 2024, detailing trip durations, ride frequencies, station destinations, and date-time information.
Google linked to data provided by Lyft and Divvy from their Chicago operations. The data has been made available by Motivate International Inc. under this license.
A Data Dictionary is attached in the Appendix.
Data Cleaning and Manipulation
Google provided a starter template to clean the data, initially covering only Q1 2019 and Q1 2020. This template was significantly modified to clean all of 2024. See full data cleaning script.
Data cleaning consisted of:
● Created columns for day, month, year, season, and day of the week to support aggregation.
● Calculated ride_length in minutes.
● Removed negative ride_length values, including
company-flagged quality control rides.
● Removed duplicate rides.
● Removed outliers, conservatively dropping the longest 0.25% of rides (>4.5 hours).
● Switched to Leaflet for mapping due to the transition from station-based coordinates in 2019 to more granular bike location data, making it impossible to map single stations.
Analysis
Casual riders’ trips last almost twice as long as members’ trips (20 minutes vs. 12 minutes).
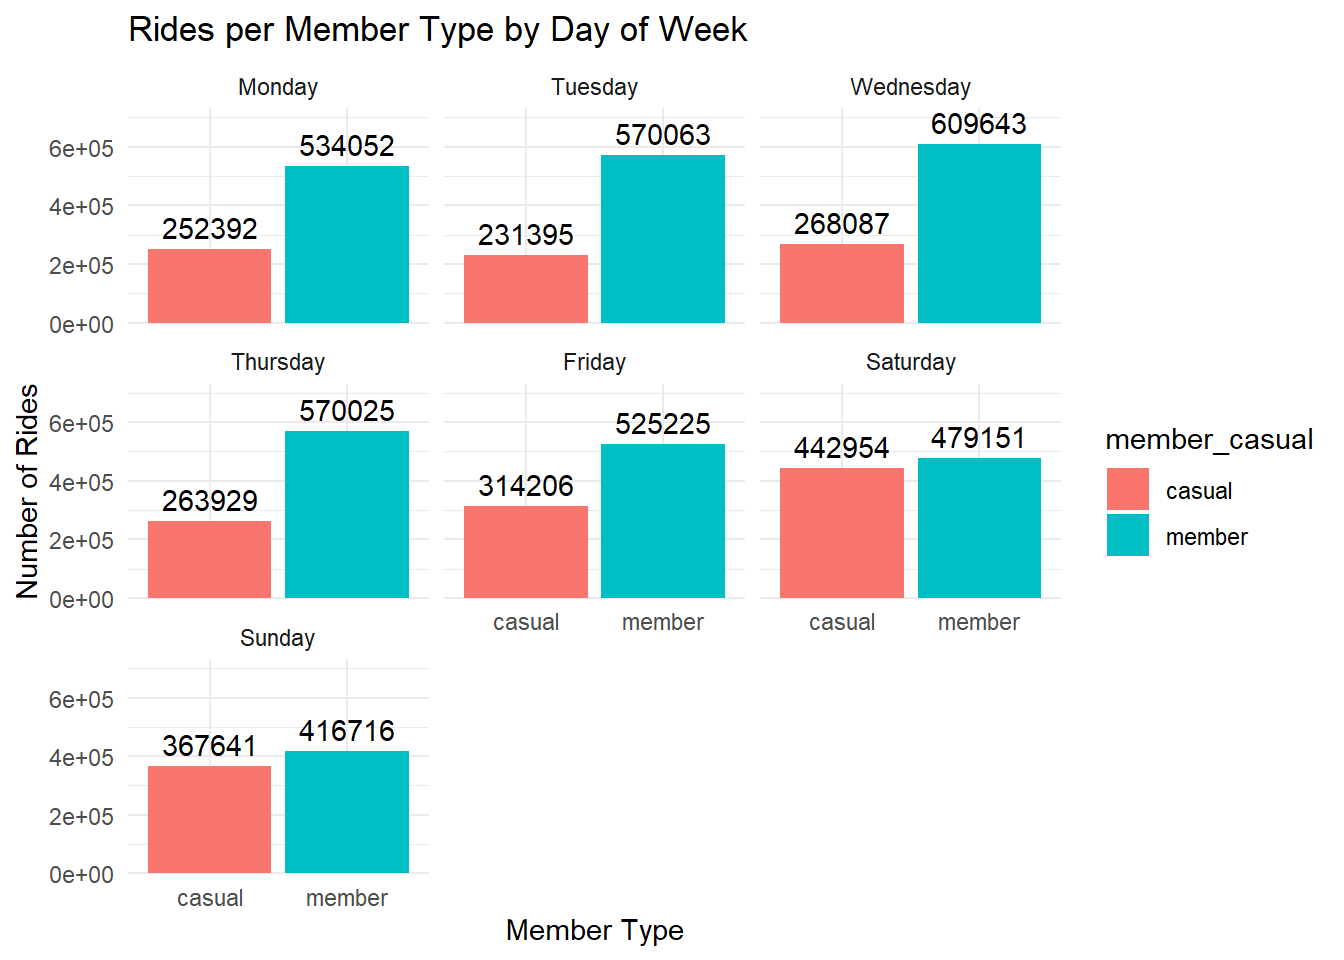
Members take significantly more trips overall, with regular weekday commuting patterns.
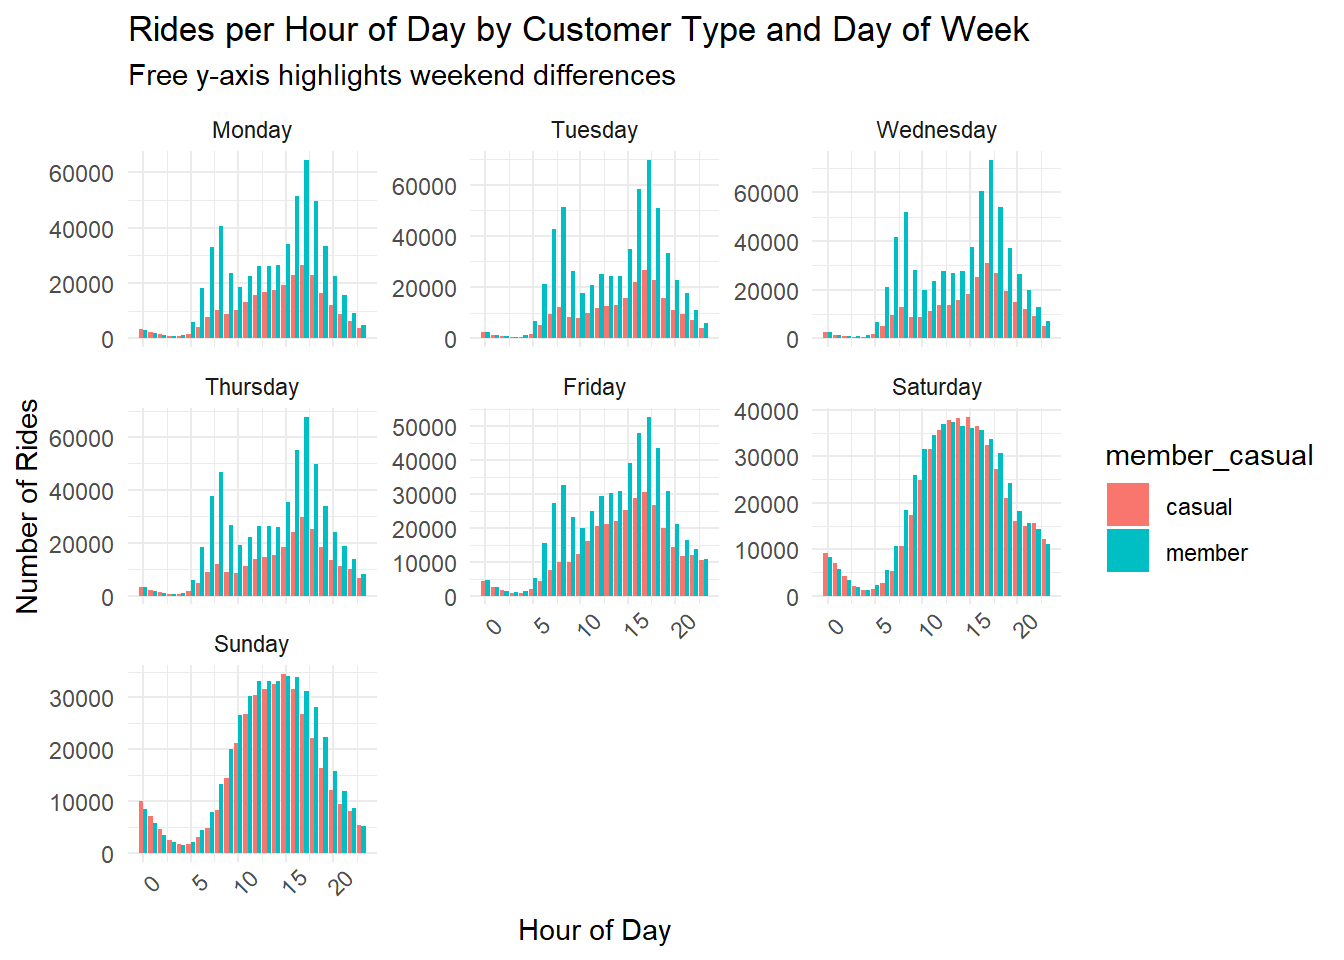
Trip timing differs:
Members peak during weekday commuting hours (8 AM & 5 PM).
Casual riders peak on weekend afternoons.
Trip locations differ:
Members primarily ride to The Loop, River North, and key transit hubs for commuting.
Casual riders frequent tourist/leisure spots (e.g., Shedd Aquarium, Theater on the Lake).
Further insights are available in the exploratory data analysis.
Supporting Visualizations
Ride Length Comparison
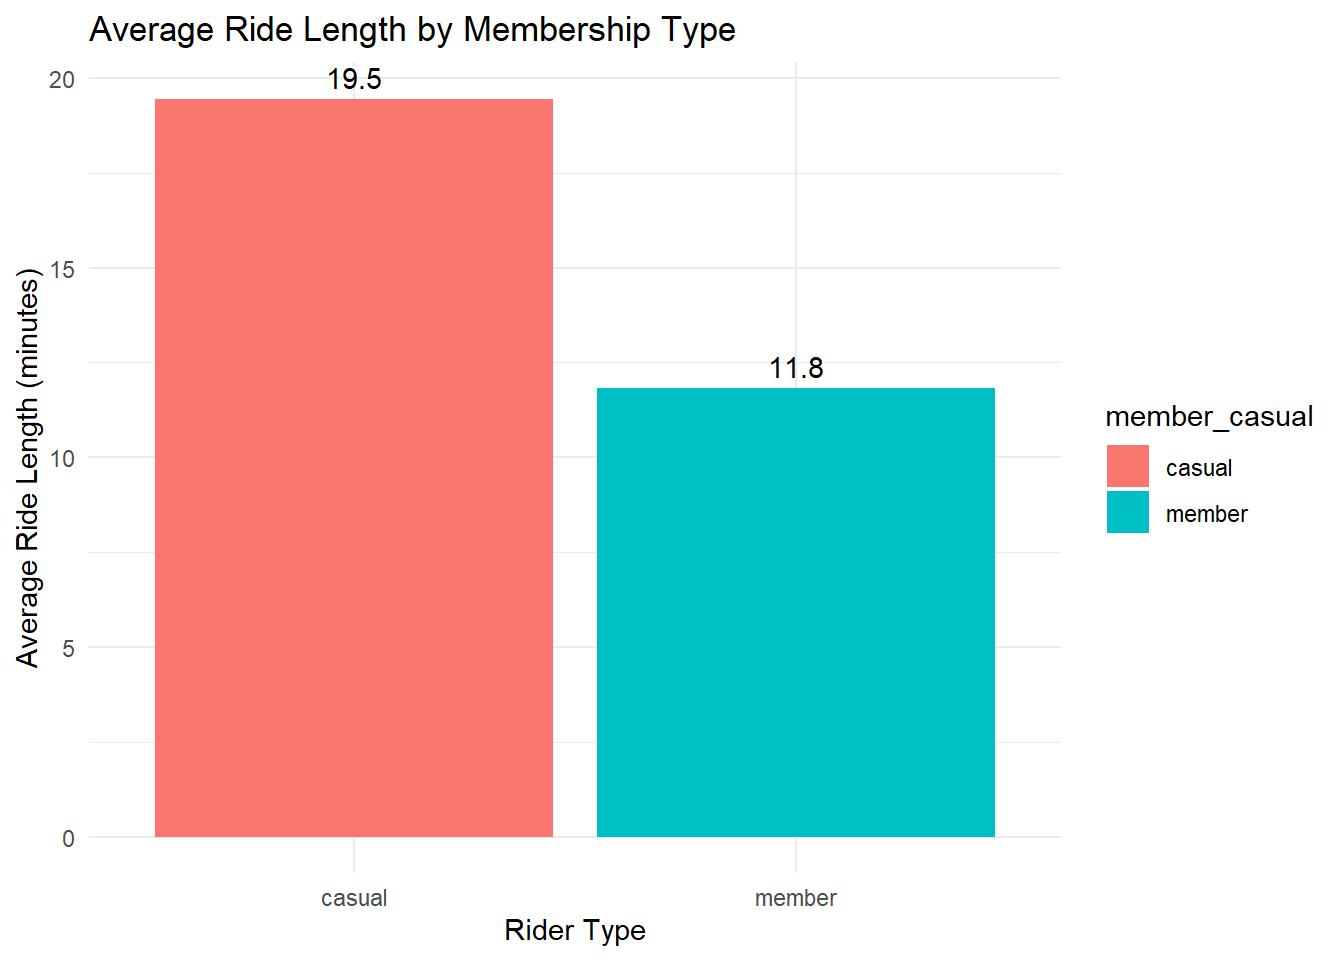
Casual Riders: ~20-minute rides
Members: ~12-minute rides
Ride Volume Comparison
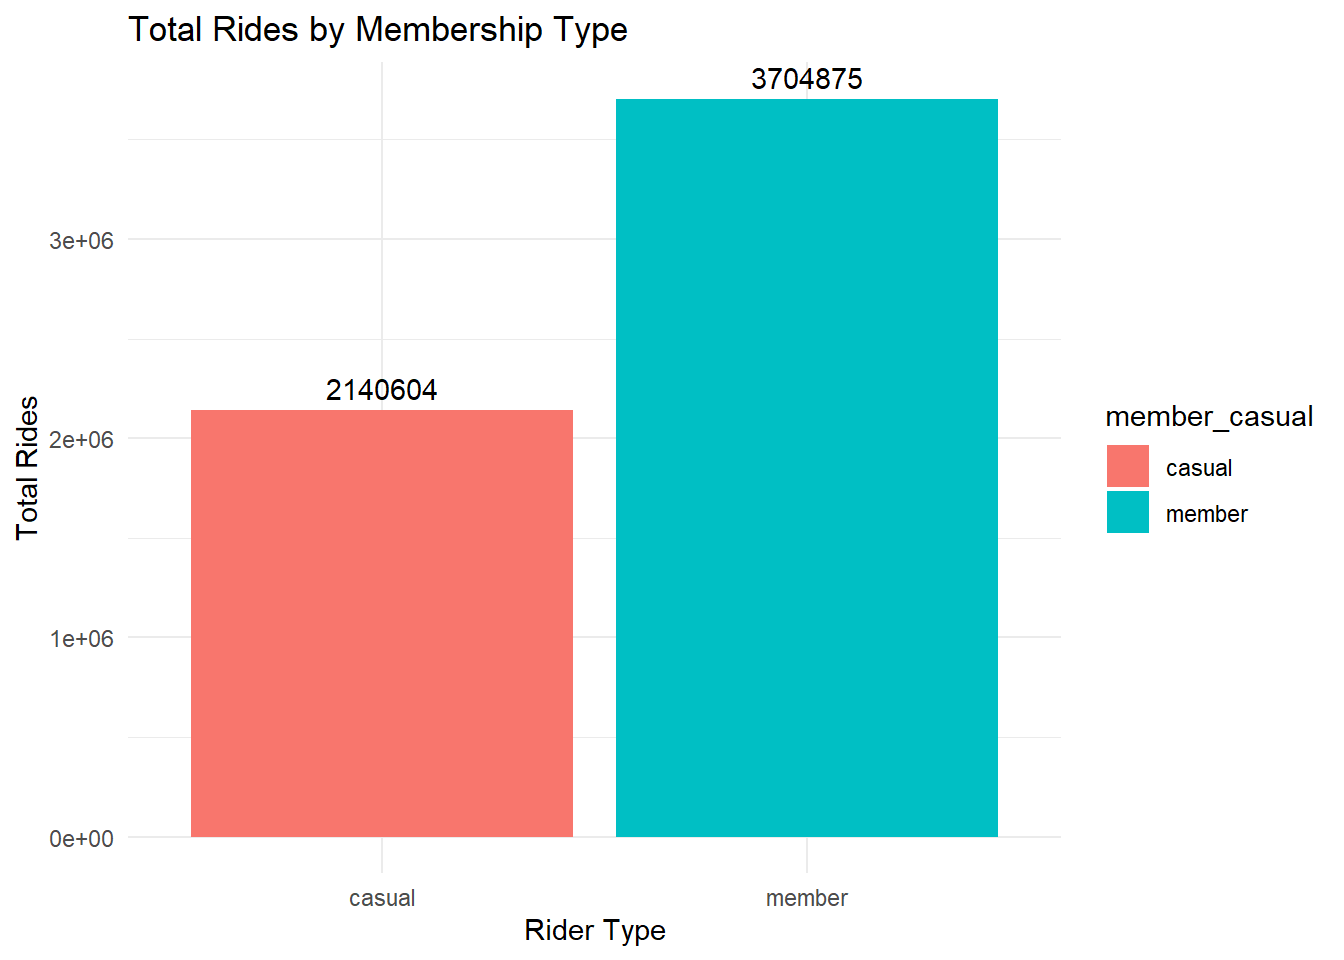
- Members take almost 2x more trips than casual riders (3.7 million vs. 2.1 million).
Seasonal Trends
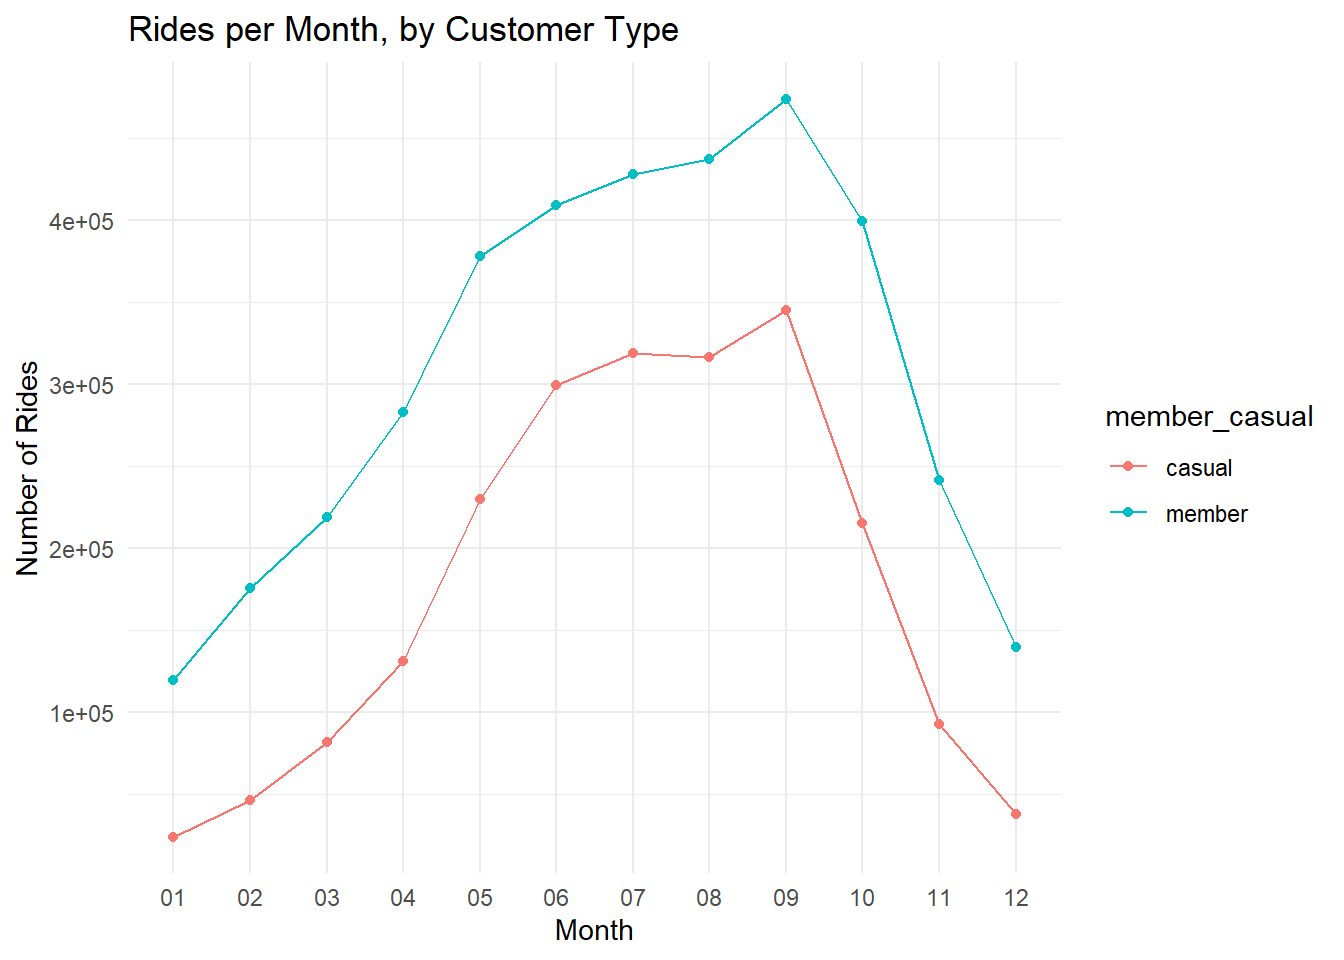
Ridership peaks in September and nadirs in January.
Seasonality affects both groups similarly.
Hourly Ride Patterns
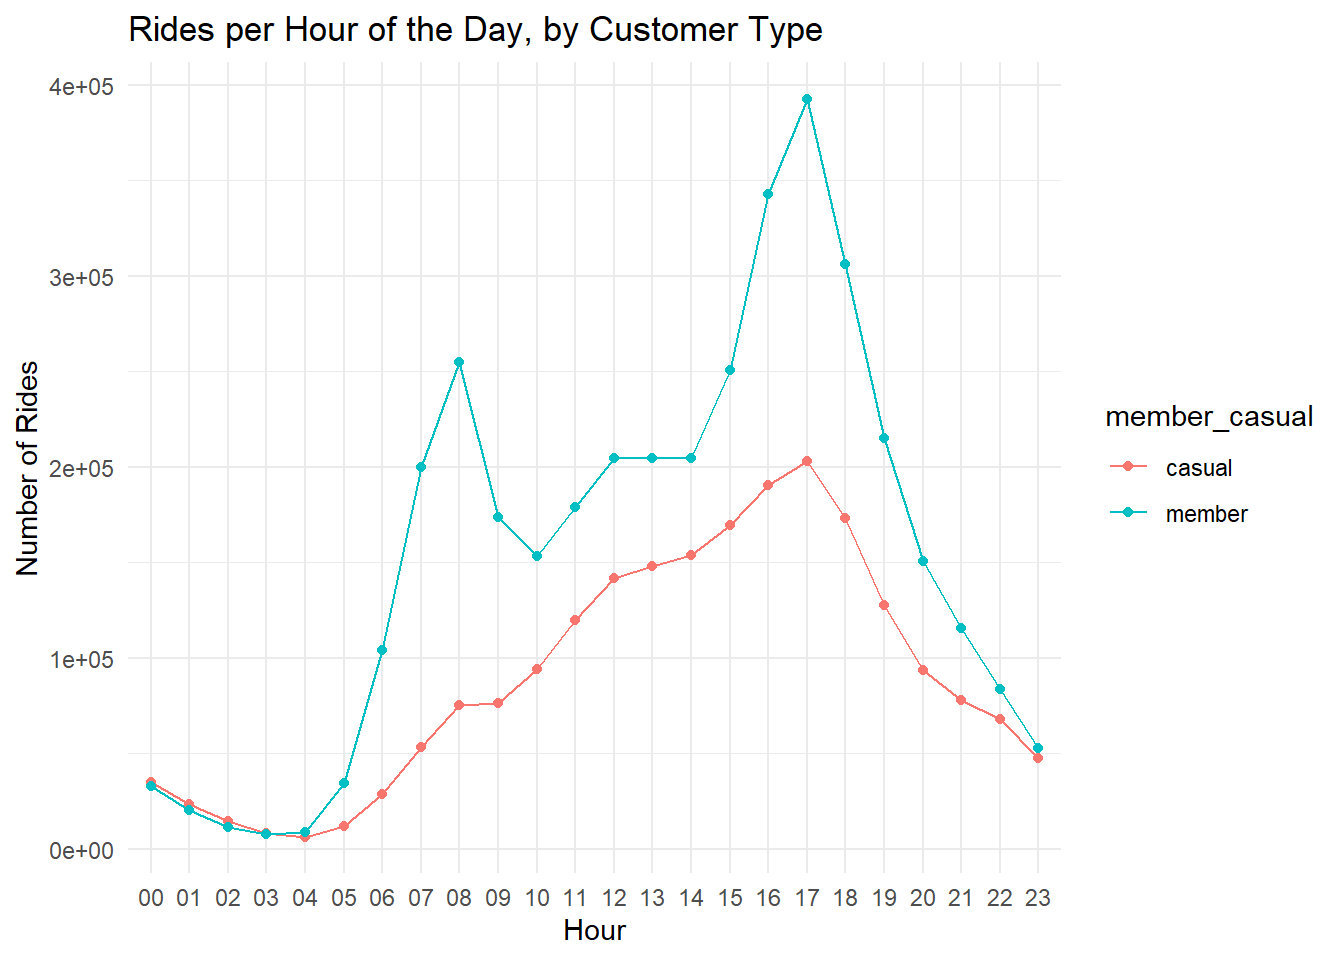
Casual Riders: Peak late afternoon, especially on weekends.
Members: Peak during weekday commuting hours (8 AM & 5 PM).
Top Stations by Rider Type
| Station | Member Rides |
|---|---|
| Kingsbury St & Kinzie St | 29499 |
| Clinton St & Washington Blvd | 27712 |
| Clinton St & Madison St | 24874 |
| Clark St & Elm St | 24681 |
| Wells St & Concord Ln | 20659 |
| Wells St & Elm St | 20482 |
| Clinton St & Jackson Blvd | 20288 |
| Dearborn St & Erie St | 19468 |
| Canal St & Madison St | 19067 |
| State St & Chicago Ave | 19041 |
| Station | Casual Rides |
|---|---|
| Streeter Dr & Grand Ave | 50801 |
| DuSable Lake Shore Dr & Monroe St | 33884 |
| Michigan Ave & Oak St | 24969 |
| DuSable Lake Shore Dr & North Blvd | 22992 |
| Millennium Park | 22374 |
| Shedd Aquarium | 20969 |
| Dusable Harbor | 18325 |
| Theater on the Lake | 16715 |
| Michigan Ave & 8th St | 13406 |
| Adler Planetarium | 12846 |
This skips the top station, NA, as electric bikes commonly don’t use a docking station.